I have seen this question pop up several times on the lists and in IRC and thought that it may be useful for somebody to explain how I accomplish this in my own environment. Note that this may not be the most efficient way to accomplish this, but it does work (so far). This also gives you an idea of how to use net-snmp's "extend" functionality to pipe additional data and metrics through net-snmp. This type of setup can be used to monitor other stuff -- for example, BIND statistics.
For the purpose of this HOWTO, we are going to obtain 5 stats from Postfix:
- Messages Sent/5min
- Messages Received/5min
- Messages Rejected/5min
- Messages Bounced/5min
- Postfix Queue
Postfix Data Collection
Because postfix does not not interface with SNMP, we need to gather the data using something else that runs locally on the Postfix server. We will use Craig Sander's Postfix MRTG scripts (http://taz.net.au/postfix/mrtg/) as our basis.
update-mailstats.pl is a daemon that will run on your Postfix server and collect data. Out of the box, this script only collects messages sent/received (local and remote) but we are going to extend it to collect bounced and rejected messages as well:
use DB_File; use File::Tail ; $debug = 0;

$mail_log = '/var/log/maillog' ; $stats_file = '/mirror/etc/stats.db' ;

$db = tie(%stats, "DB_File", "$stats_file", O_CREAT|O_RDWR, 0666, $DB_HASH)
    || die ("Cannot open $stats_file");

#my $logref=tie(*LOG,"File::Tail",(name=>$mail_log,tail=>-1,debug=>$debug)); my $logref=tie(*LOG,"File::Tail",(name=>$mail_log,debug=>$debug));

while () {

    if (/status=sent/) {

        next unless (/ postfix//) ; # count sent messages if (/relay=([^,]?+)/o) {

            $relay = $1 ; #print "$relay..." ;

        } ; if ($relay !~ /[/o ) {

            $stats{"SENT:$relay"} += 1; #print "$relayn" ;

        } else {
            $stats{"SENT:smtp"} +=1 ; #print "smtpn" ;

        } ; $db->sync;
    } elsif (/status=bounced/) {
        # count bounced messages $stats{"BOUNCED:smtp"} += 1; $db->sync ;
    } elsif (/NOQUEUE: reject/) {
        # count rejected messages $stats{"REJECTED:smtp"} += 1; $db->sync ;
    } elsif (/smtpd.*client=/) {
        # count received smtp messages $stats{"RECEIVED:smtp"} += 1; $db->sync ;
    } elsif (/pickup.*(sender|uid)=/) {
        # count received local messages $stats{"RECEIVED:local"} += 1; $db->sync ;

    } ;

} ;

untie $logref ; untie %stats;
Make sure you have $mail_log set correctly, and start this daemon. It will create a database at $stats_file and start populating it as your maillog grows.
Now that we are collecting Postfix data, we need something to extract stats from the stats.db database which is being generated from update-mailstats.pl. Again, we will use Craig's mailstats.pl as our starting point and modify it a bit for our purpose:
use DB_File;

$|=1;

$stats_file = '/mirror/etc/stats.db' ;

tie(%foo, "DB_File", "$stats_file", O_RDONLY, 0666, $DB_HASH) || die ("Cannot open $stats_file");

if ($ARGV[0]? =~ /sent/) {

    foreach (sort keys %foo) {
        print $foo{$_} if $_ =~ /SENT/;

    }

} elsif ($ARGV[0]? =~ /received/) {

    foreach (sort keys %foo) {
        print $foo{$_} if $_ =~ /RECEIVED/;

    }

} elsif ($ARGV[0]? =~ /bounced/) {

    foreach (sort keys %foo) {
        print $foo{$_} if $_ =~ /BOUNCED/;

    }

} elsif ($ARGV[0]? =~ /rejected/) {

    foreach (sort keys %foo) {
        print $foo{$_} if $_ =~ /REJECTED/;

    }

} elsif ($ARGV[0]? =~ /queue/) {

    @mailq = split(/n/,`postqueue -p`); @line = split(' ',$mailq[$#mailq]?); print $line[4]?; print $mailq;

}

untie %foo;
Now we can run "mailstats.pl sent" for example and get the number of messages that postfix has sent:
# ./mailstats.pl sent
24428
Net-SNMP Configuration
Now that we have a way to extract this data out of the stats.db database, we need to make it available to net-snmp so ZenOSS can grab it. To do this, we will use the "extend" function from net-snmp. Add the following (or something similar) to your snmpd.conf:
# Let's pipe postfix stats to net-snmp
extend postfixSent /usr/local/bin/mailstats.pl sent
extend postfixReceived /usr/local/bin/mailstats.pl received
extend postfixQueue /usr/local/bin/mailstats.pl queue
extend postfixBounced /usr/local/bin/mailstats.pl bounced
extend postfixRejected /usr/local/bin/mailstats.pl rejected
After restarting snmpd, you should be able to retreive this stats via snmpwalk:
# snmpwalk -On -v2c -c   .1 | grep postfix
...
NET-SNMP-EXTEND-MIB::nsExtendOutputFull."postfixSent" = STRING: 24492
NET-SNMP-EXTEND-MIB::nsExtendOutputFull."postfixQueue" = STRING: 49
NET-SNMP-EXTEND-MIB::nsExtendOutputFull."postfixBounced" = STRING: 22
NET-SNMP-EXTEND-MIB::nsExtendOutputFull."postfixReceived" = STRING: 18353
NET-SNMP-EXTEND-MIB::nsExtendOutputFull."postfixRejected" = STRING:
...
To get their OID (make sure you escape the "'s with backslashes):
# snmpwalk -On -v2c -c   NET-SNMP-EXTEND-MIB::nsExtendOutputFull.\"postfixSent\"
.1.3.6.1.4.1.8072.1.3.2.3.1.2.11.112.111.115.116.102.105.120.83.101.110.116 = STRING: 24516
This is the OID that you will add as a data source in ZenOSS? to collected Postfix Sent Messages. Repeat this previous step for all 5 datasources.
ZenOSS Configuration
Now we just need to configure ZenOSS. This will encompass creating a new template, defining datasources, defining a threshold and defining two graphs to display our data. By default, ZenOSS polls SNMP every 5 minutes -- this is why our message stats are "per 5 minutes."
- Create a new template. Browse to /Devices/Server, click the Templates tab, click the dropdown and select "Add Template." Enter "Postfix" for the tempate name.
- Add data sources using the OID's that you found earlier. We will add four datasources. Here are the OID's that I used in my environment. You should be able to SNMPWALK all of these OID's from your ZenOSS? machine:
- postfixBounced - 1.3.6.1.4.1.8072.1.3.2.3.1.1.14.112.111.115.116.102.105.120.66.111.117.110.99.101.100 (Type: COUNTER)
- postfixQueue - 1.3.6.1.4.1.8072.1.3.2.3.1.1.12.112.111.115.116.102.105.120.81.117.101.117.101 (Type: GAUGE)
- postfixReceived - 1.3.6.1.4.1.8072.1.3.2.3.1.1.15.112.111.115.116.102.105.120.82.101.99.101.105.118.101.100 (Type: COUNTER)
- postfixSent - 1.3.6.1.4.1.8072.1.3.2.3.1.1.11.112.111.115.116.102.105.120.83.101.110.116 (Type: COUNTER)
- postfixRejected - 1.3.6.1.4.1.8072.1.3.2.3.1.1.15.112.111.115.116.102.105.120.82.101.106.101.99.116.101.100 (Type: COUNTER)
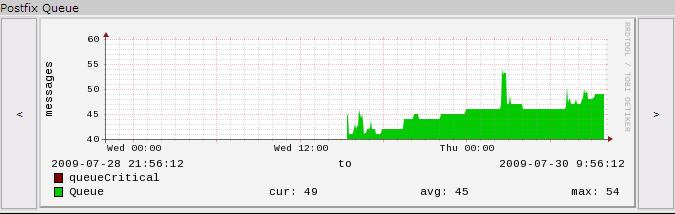
- Add a threshold. I added a threshold for postfixQueue to alert me if postfixQueue exceeds 200.
- Define two graphs:
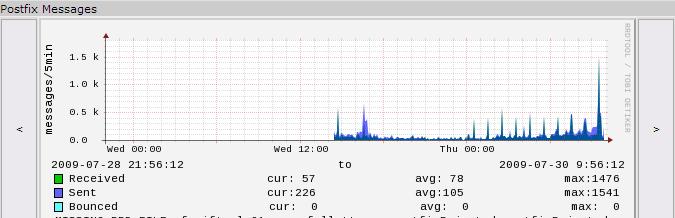
- Name: Postfix Messages. Add four graph points - received, sent, bounced, rejected. The RPN for all of these graph points MUST be "300,*" I used "%3.0lf" for my "format" for all of these points as well. The "Units" should be "messages/5min"
- Name: Postfix Queue. Add one graph point - queue. RPN should be default, graph point format should be "%3.0lf" and unit should be "messages" You can also add your threshold to this graph if you would like.
To use your newly created template, you will need to bind it to a device or device class using the Templates -> Bind Templates option. After the template is bound, you should now be collecting postfix data. Check the performance tab of a device and you should see two new graphs. Note that the graphs will not be viewable immediatly -- give it at least 10 minutes.
I hope that this information is useful. Remember that you can use the net-snmp "extend" functionality to present a number of interesting metrics to SNMP. I use this same method for providing BIND stats to ZenOSS via SNMP.
Josh Baird (jb @ irc.freenode.net / jbaird at http://forums.zenoss.com/)
