Submitted by:
Anton Menshutin
Description:
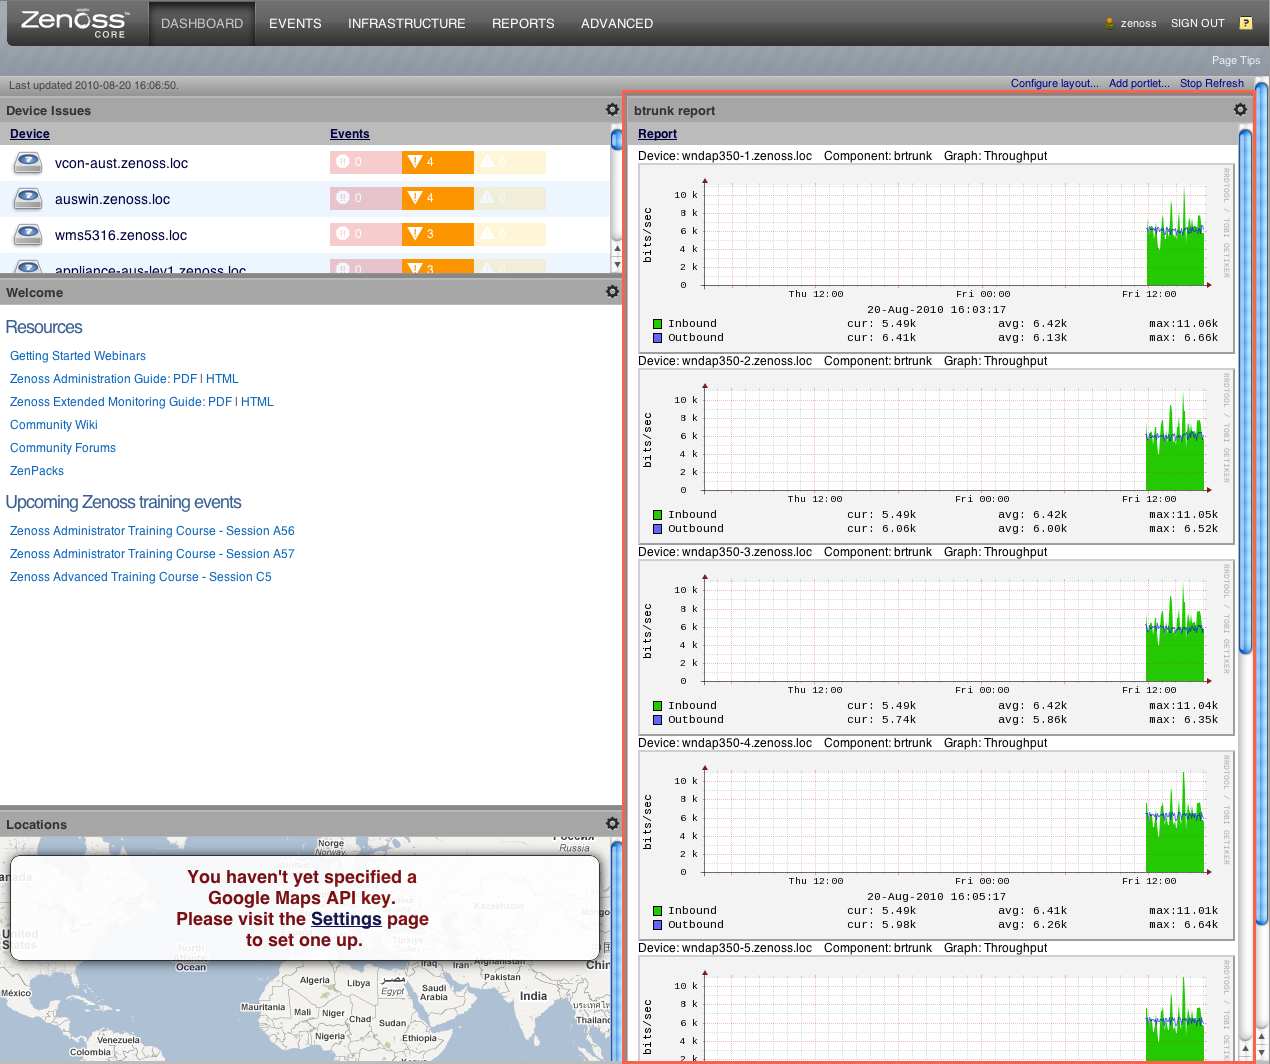
This ZenPack adds a portlet called "Show Graph" which enables users to show any graph/multi graph reports on their dashboard. Several columns (as defined in report options) are supported.
Screenshots:
REQUIREMENTS:
- Zenoss Version: 3.0
- ZenPack Dependencies: none
- External Dependencies: none
- Installation: You need to restart Zenoss after installation.
- Configuration: while the UI allows you to select any report, make sure you select a Graph Report.
Source: http://zenpacks.zenoss.org/trac-zenpacks/browser/zenpacks/ZenPacks.SCC.ShowGraphPortlet
Tagged Releases:
- http://zenpacks.zenoss.org/trac-zenpacks/browser/tags/graph-portlet-1.01
- http://zenpacks.zenoss.org/trac-zenpacks/browser/tags/graph-portlet-1.03
Change History:
- Version 1.03 upgraded to support Zenoss 3.0.
Trac tickets: http://zenpacks.zenoss.org/trac-zenpacks/report/1
Known issues:
