SUBMITTED by:
DESCRIPTION: Provides a pair of templates for generating graphs depicting the total number of events received over time. The graphs are stacked and colored to match event severity.
Executes a simple Python script to query MySQL database for event counts. The two templates are:
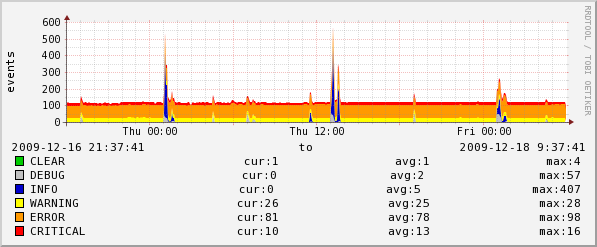
All Events - this template in /Devices/Server that should be bound to the Zenoss server and provides a graph of all events being processed by the Zenoss server.
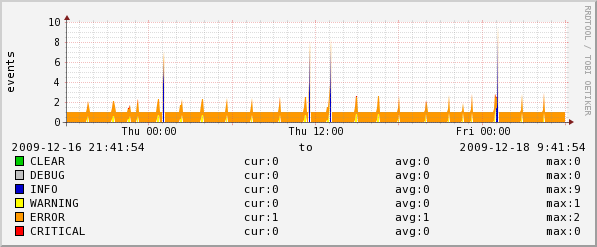
Device Events - this template in /Devices may be bound to any device class or device and provides a graph of all events against the individual device.
SCREENSHOTS:
All Events
Device Events
REQUIREMENTS:
- Zenoss Version: 2.2
- ZenPack Dependencies:
- External Dependencies:
- Installation: If your MySQL password is not the default, you may have to edit the .py files under libexec within the ZenPack.
Source: http://zenpacks.zenoss.org/trac-zenpacks/browser/zenpacks/ZenPacks.community.EventGraph.BySeverity
Tagged Releases:
- http://zenpacks.zenoss.org/trac-zenpacks/browser/tags/eventgraph-1.1
- http://zenpacks.zenoss.org/trac-zenpacks/browser/tags/eventgraph-2.0
- http://zenpacks.zenoss.org/trac-zenpacks/browser/tags/eventgraph-4.0
Change History:
- 1.0 initial release
- 1.1 fixed path issues
- 2.0 split out templates into All Events and Device Events
- 4.0 optimization rewrite to 2 Python scripts with 1 MySQL query each
Trac tickets: http://zenpacks.zenoss.org/trac-zenpacks/report/1
Known Issues:
