This is a collection of tips for fun things you can add via the Site Window Portlet, which is included in Zenoss 2.5.
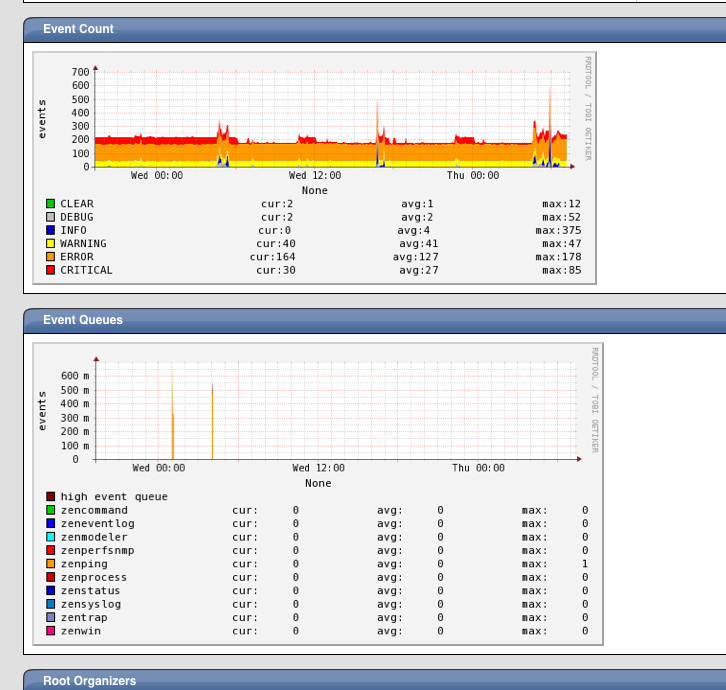
Performance Graphs
- If you want to add performance graphs to your Dashboard:
- Go to the graph you want on your dashboard.
- Right click on it and select "copy image url"
- Go to the dashboard and add a "Site Window" portlet
- Open the settings for the new Site Window portlet
- Paste in the URL, trim the end off after "&drange=129600&width=500&start=end-129600s&end=now-0s" so the labels aren't static
- Change the Title to whatever you want it to be (ie. the name of the graph)
- Save settings and you should have the graph on your dashboard
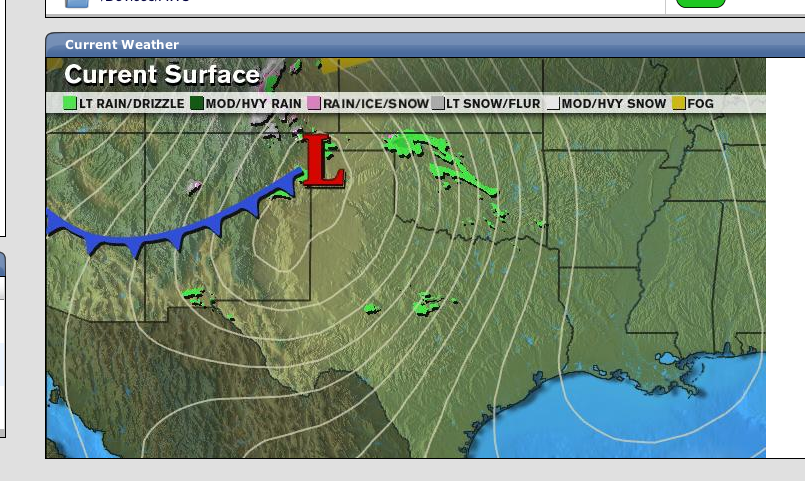
Weather Maps
- Go to weather.com (or wherever) and find the map that you want on your dashboard.
- Copy the URL (ie. http://i.imwx.com/images/maps/current/cur_sc_720x486.jpg)
- Paste it into the Site Window
- Change the Title
- Save
