Multi-graph reports combine data from different devices and components into a single report. You can create a graph definition and have it drawn once for each of a group of devices and components that you define. Alternatively, you can combine the data for those graphs into a single graph.
The groups of devices and components you assemble are called collections. Specifying the graph definitions to apply to collections is done through graph group objects.
Multi-graph reports include their own graph definitions, and thus do not use the graph definitions that are defined in monitoring templates. (To create a report that includes graphs defined on templates, use a graph report.)
Like graph reports, multi-graph reports offer two different views: normal and print.
To create a multi-graph report:
From a report organizer or sub-organizer in the tree view, select Add Multi-Graph Report from the Add Menu.
The Create Multi-Graph Report dialog appears.
Enter a name for the report, and then click Submit.
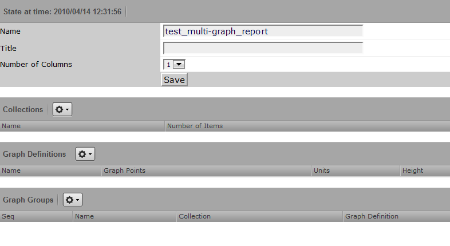
In the report edit page, enter or select values for:
Name - Displays at the top of the report.
Title - Displays at the top of the printable version of the report.
Number of Columns - Specifies the number of columns (1-3) in which graphs will appear on the report.
After creating the multi-graph report, you must also add one or more:
Collections, which contain the devices and components you want to graph
Graph definitions, which describe the graphs you want on the report
Graph groups, which specify the collection and graph definition.
A collection comprises one or more collection items. A collection item can be a list of device classes, systems, groups, locations, or specific devices or components. A single collection may contain as many collection items as desired.
A multi-graph report must contain at least one collection. Collections are shown in the Collections area of the report's edit page.
To create a collection:
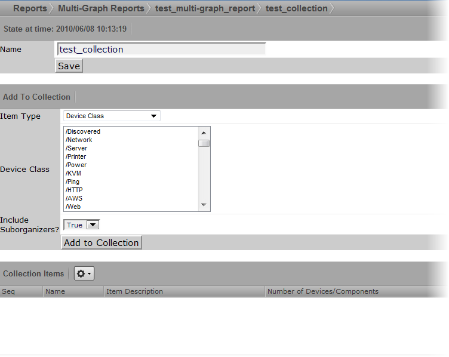
To add collection items to a collection:
Select a value for Item Type. The Item type menu lets you select:
Device Class/System/Group/Location - Selecting one of these options reveals a list of all organizers of that type. You can select one or more of the organizers to include in the collection.
Specific Device/Component - Selecting this option reveals a list of all devices. You can use the Filter field to narrow this list by entering a full or partial device name. Selecting one or more devices will display a list of component names that apply to one or more of the selected devices.
Select a value for Include Suborganizers. If true, then the collection will also include all organizers recursively beneath the selected organizer. These collection items are dynamic: when devices are added or removed from the organizers, they will appear or disappear from the report.
Click Add to Collection to create a new collection item for each of the selected organizers or specific device.
You can re-order collection items. Their listed order determines the order in which the graphs are drawn, or the order that data is drawn on a combined graph.
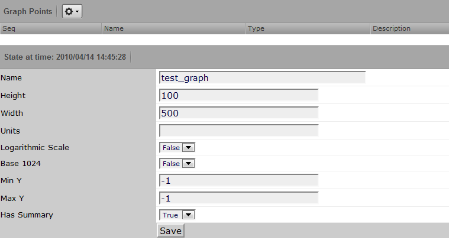
In the context of multi-graph reports, graph definitions are very similar to those in monitoring templates. Settings on the graph definition define basic parameters; graph points are added to specify which data should be drawn. (For more information on creating graph definitions, see the chapter titled Performance Monitoring.)
The most significant differences between graph definitions in the two contexts is how data point graph points and threshold graph points are added. When adding a data point graph point to a graph definition in a performance template, you can select from a list of data points that are defined on that template. In the context of a multi-graph report, there are no graph point definitions listed; you must enter the name of the data point on the data point graph point dialog.
To add a graph definition:
From the Action menu on this page, you can:
Add data points and thresholds
Delete the graph point
Re-sequence graph points
Graph groups combine a graph definition with a collection to produce graphs for the report. Without at least one graph group, the report will show no graphs.
To create a graph group:
Select Add Group from
 (Action Menu) in the Graph Groups area of the graph edit page.
The Add a New Graph Group dialog appears.
Enter a name for the graph group, and then click OK.
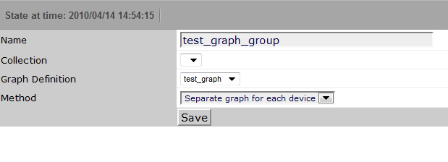
Enter information or make selections on the edit page:
Name - Identifies the graph group on the multi-graph report page. It does not appear on the report.
Collection - Select a collection that has been defined for this report.
Graph Definition - Select a graph definition that has been defined for this report.
Method - Choose to have the graph drawn once for each device and component in the collection, or combine the data from all devices and components into a single graph. Options are:
Separate graph for each device - The graph definition is used to draw one graph for each device and component in the collection. Graphs will appear in the list in roughly the same order they are specified in the collection.
All devices on a single graph - Draws one graph with the data from all devices and components included.
Click Save to save the graph group.
Graph groups are drawn in the order listed on the multi-graph report edit page. You can change the order of the graph groups:
In the Seq column of the Graph Groups area, enter numbers next to one or more graph groups.
Select Re-sequence items from Actions Menu.
The page refreshes and displays the graph groups in the re-sequenced order.
Note
If a graph group results in multiple graphs, then the graphs are drawn in the order that the collection items are listed the corresponding collection. If a collection item specifies a device organizer, then the order of the devices drawn from that collection item is indeterminate.


