Archived community.zenoss.org | full text search
Skip navigation
43021 Views 7 Replies Latest reply: Jul 27, 2007 3:56 PM by nutria RSS
nutria Newbie 3 posts since
Jul 24, 2007
Currently Being Moderated

Jul 24, 2007 6:27 PM

performance graph - gaps

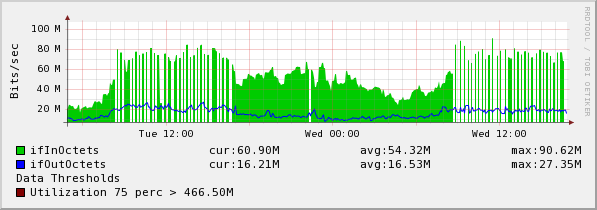
when graphing an oc12 interface on a cisco 12000 all looks fine until graph exceeds 55mb/s then the graph start to gap. Nothing for a couple of minute then it plots again it does this until throughput drops back below 55mb/s. any ideas?? Gap only happen on the ifInOctets not on the ifOutOctets, the out continues to graph correctly but does not exceed 40mb/s[/img]
  • jamesroman Rank: Green Belt 118 posts since
    Apr 19, 2007
    Currently Being Moderated
    1. Jul 25, 2007 8:44 AM (in response to nutria)
    performance graph - gaps
    Does this happen only on one graph, or do all the graphs gap? Have you
    changed the snmp cycle time from its default for this device? Is there a
    max value set on the data point for this device?

    My first guess would be that there is a maximum value set on the data
    point, and when an RPN transform is done on the value, it exceeds that
    value. You can use:

    rrdtool info /path/to/rrdfile/ifInOctets_ifInOctets.rrd | grep "^ds"

    to view the configuration of the rrd file. It will show if there is any
    min or max values set and what the update time is (steps = 300 = 5mins,
    etc).

    Additionally, the heartbeats value may be of interest. It should be
    three times the step time. If you do not get a value within that
    minimal_heartbeat, you will get a gap. The default is 15 minutes (900).


    On Tue, 2007-07-24 at 22:27 +0000, nutria wrote:


    when graphing an oc12 interface on a cisco 12000 all looks fine until graph exceeds 55mb/s then the graph start to gap. Nothing for a couple of minute then it plots again it does this until throughput drops back below 55mb/s. any ideas?? Gap only happen on the ifInOctets not on the ifOutOctets, the out continues to graph correctly but does not exceed 40mb/s[/img]

    ------------------------
    Troy Bourque


    _______________________________________________
    zenoss-users mailing list
    zenoss-users@zenoss.org
    http://lists.zenoss.org/mailman/listinfo/zenoss-users
    --
    James D. Roman
    IT Network Administration

    Terranet Inc.On contract to:
    Science Systems and Applications, Inc.

    _______________________________________________
    zenoss-users mailing list
    zenoss-users@zenoss.org
    http://lists.zenoss.org/mailman/listinfo/zenoss-users
  • jkgainey Rank: White Belt 25 posts since
    Jun 14, 2007
    Currently Being Moderated
    2. Jul 25, 2007 4:44 PM (in response to jamesroman)
    RE: performance graph - gaps
    I have a similar, if not the same, issue with the performance graphs. However, on mine it affects all performance graphs on all systems that are using the default Device template for the Server class. Every graph, cpu utilization, load average, cpu idle, Free swap, and Free memory has these gaps. it occurs for about 15 - 20 minutes every day at varying times each day.
  • Currently Being Moderated
    3. Jul 25, 2007 4:50 PM (in response to jkgainey)
    performance graph - gaps
    What does your zenpferfsnmp.log say during this period?


    On Wed, Jul 25, 2007 at 08:44:59PM +0000, jkgainey wrote:


    I have a similar, if not the same, issue with the performance graphs. However, on mine it affects all performance graphs on all systems that are using the default Device template for the Server class. Every graph, cpu utilization, load average, cpu idle, Free swap, and Free memory has these gaps. it occurs for about 15 - 20 minutes every day at varying times each day.


    --
    David Carmean Network Appliance, Inc
    Infosystems Architect, 495 E. Java Drive
    Java (Sunnyvale) Engineering Lab Services Sunnyvale, CA 94089
    _______________________________________________
    zenoss-users mailing list
    zenoss-users@zenoss.org
    http://lists.zenoss.org/mailman/listinfo/zenoss-users
  • jkgainey Rank: White Belt 25 posts since
    Jun 14, 2007
    Currently Being Moderated
    5. Jul 26, 2007 10:35 AM (in response to nutria)
    RE: performance graph - gaps
    zenperfsnmp.log doesn't report anything out of the ordinary. mostly INFO messages like:

    
    2007-07-25 10:56:53 INFO zen.zenperfsnmp: Count 1119 good 205 bad 37 time 10.941692


    and

    
    2007-07-25 10:56:53 WARNING zen.zenperfsnmp: Error reading value for "memCached" on web5061 (oid .1.3.6.1.4.1.2021.4.15.0 is bad)
    
  • jamesroman Rank: Green Belt 118 posts since
    Apr 19, 2007
    Currently Being Moderated
    6. Jul 26, 2007 11:35 AM (in response to jkgainey)
    performance graph - gaps
    Seems OK to me. Looking at some of my GB Ethernet graphs I am seeing the
    same thing, only affecting the throughput graph for the device. When I
    do a fetch on the data, I notice that there are actual gaps in the data.
    (Note for -e use the last update time from your rrdinfo request)

    rrdtool fetch ifOutOctets_ifOutOctets.rrd AVERAGE -r 300 -s
    1185457200-11h -e 1185457200
    ds0

    1185417900: 9.0082998595e+06
    1185418200: 1.4975690862e+06
    1185418500: 1.7772404216e+06
    1185418800: 3.3598414489e+06
    1185419100: 4.7576243543e+06
    1185419400: 2.2859369136e+06
    1185419700: 2.2931599666e+06
    1185420000: nan
    1185420300: 5.6506358707e+05
    1185420600: 4.1672178753e+06
    1185420900: 8.1344753967e+06
    1185421200: nan

    I see nothing in the zenperfsnmp.log file to indicate a problem
    collecting the data, assuming the return value was valid, it looks like
    it is just a problem with recording it.

    When you do an snmpget on the octet OID, what type of counter is
    returned?

    My hunch is that you may be hitting a boundary in the limit of a 32-byte
    counter that is causing the derive to question whether the counter is
    32bit or 64bit. When this occurs, a derive database will report UNKNOWN.
    A 32bit counter wraps at 4,294,967,296. This is still reasonable for the
    router record in a 32bit counter at a 5 minute interval. However, we are
    using an rpn transform that multiplies the value by 8 (to convert to
    bits) The problem is if the multiplied value wraps more than once, or
    worse, wraps within less than 300 bytes of the previous value (since the
    value will be divided by the number of seconds to establish a bit rate).
    You could end up with a negative number, which would be below the
    minimum limit.

    Here is a note on Counter vs. Derive from the rrdcreate man page:

    If you cannot tolerate ever mistaking the occasional counter
    reset for a legitimate counter wrap, and would prefer "Unknowns"
    for all legitimate counter wraps and resets, always use DERIVE
    with min=0. Other-wise, using COUNTER with a suitable max will
    return correct values for all legitimate counter wraps, mark
    some counter resets as "Unknown", but can mistake some counter
    resets for a legitimate counter wrap.

    For a 5 minute step and 32-bit counter, the probability of
    mistaking a counter reset for a legitimate wrap is arguably
    about 0.8% per 1Mbps of maximum bandwidth. Note that this
    equates to 80% for 100Mbps inter-faces, so for high bandwidth
    interfaces and a 32bit counter, DERIVE with min=0 is probably
    preferable. If you are using a 64bit counter, just about any max
    setting will eliminate the possibility of mistaking a reset for
    a counter wrap.


    Most of the other monitoring products I've used, do the byte transform
    (multiplying by 8) when building the graph, rather than changing the
    data before it gets stored. You could test this theory by creating a
    second data point under your octet data source and storing the raw value
    (no rpn transform). Note that in your situation, it may not eliminate
    all gaps, but should reduce them.

    If this truly is the problem, you could either

    1) modify the data point configuration and make a custom graph to
    perform the transform on the new value. If your already recording the
    data, you would just need to add a new custom graph.

    2) If you have a 64bit counter on your router, you could eliminate the
    ambiguity by specifying the maximum value of a 64 bit counter (2^64 * 8)
    by using rrdtool tune --maximum. I'm not entirely sure whether rrd
    databases will accept this value or not). Worst case you can change it
    back.

    2) Alternatively, you could set your snmp cycle time to a shorter
    period. This gets tricky however. You should start over with new RRD
    files when you do this since the already created RRD files would still
    have the step time set to 300 seconds. Although Zenoss includes a script
    to migrate to a new step time (at least in Zenoss 1.1.2), it is not 100
    percent reliable. You should also revise the RRA commands that record
    data. I've tried this myself, but was not totally satisfied with the
    results.


    On Wed, 2007-07-25 at 21:59 +0000, nutria wrote:


    This is the output from 'rrdtool info':

    filename = "ifInOctets_ifInOctets.rrd"
    rrd_version = "0003"
    step = 300
    last_update = 1185396019
    ds[ds0].type = "DERIVE"
    ds[ds0].minimal_heartbeat = 900
    ds[ds0].min = 0.0000000000e+00
    ds[ds0].max = NaN
    ds[ds0].last_ds = "4021794063"
    ds[ds0].value = 1.8193199239e+08
    ds[ds0].unknown_sec = 0


    Nothing seems to be out of the ordinary in the zenperfsnmp log file.

    This is a capture of my graph:


    ------------------------
    Troy Bourque


    _______________________________________________
    zenoss-users mailing list
    zenoss-users@zenoss.org
    http://lists.zenoss.org/mailman/listinfo/zenoss-users

    --
    James D. Roman
    IT Network Administration

    Terranet Inc.On contract to:
    Science Systems and Applications, Inc.

    _______________________________________________
    zenoss-users mailing list
    zenoss-users@zenoss.org
    http://lists.zenoss.org/mailman/listinfo/zenoss-users

More Like This

  • Retrieving data ...