Submitted by: Colin Hudler (chudler)
Description:
With this ZenPack you can monitor the status of your Google AppEngine applications. It provides:
- All Quota statistics (allowances, percent used, and raw used).
- Application status (version deployed)
- Monitoring of multiple google accounts
- Automatic detection of new quotas types
- Automatic detection of new applications and changes to existing applications
- Much more is planned...
Screenshots:
REQUIREMENTS:
Zenoss Version: tested with 2.5.1
ZenPack Dependencies: None
External Dependencies: None
Installation:
- Install the ZenPack using the standard methods. (webui, or zenpack --install) You should restart Zenoss afterwards.
- Navigate to the new Root Device Organizer called AppEngine.
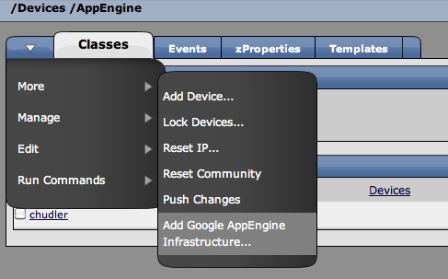
- From the AppEngine Device Organizer, use the "Arrow" menu to Add the AppEngine Infrastructure (see screenshot below)

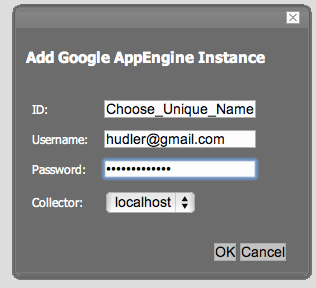
- Enter a unique name for your Google Instance. This name will become the organizer that your applications are gathered under. Each Instance will monitor one or more applications running under the Google account that you provide. This ZenPack supports independent monitoring of multiple google accounts.
- Once your information is entered, Zenoss will connect to google and discover your AppEngine applications. Read on for more information.
Features/Synopsis:
This version monitors per-application quota statistics and application versions numbers. More is planned in the future. The following metrics are gathered from AppEngine (all metrics include Percent Used):
- CPU Time (Raw Used CPU Hours, Total Allocation)
- Requests (Used, Total Allocation)
- Outgoing Bandwidth (Used, Allocation in GBytes)
- Incoming Bandwidth (Used, Allocation in GBytes)
- Secure Requests (Used, Allocation)
- Secure Outgoing Bandwidth (Used, Allocation in GBytes)
- Secure Incoming Bandwidth (Used, Allocation in GBytes)
- Datastore API Calls (Used, Allocation)
- Blobstore API Calls (Used, Allocation)
- Total Stored Data (Used, Allocation in GBytes)
- Blobstore Stored Data (Used, Allocation in GBytes)
- Data Sent to Datastore API (Used, Allocation in GBytes)
- Data Received from Datastore API (Used, Allocation in GBytes)
- Datastore CPU Time (Used CPU Hours, Total Allocation)
- Mail API Calls (Used, Allocation)
- Recipients Emailed (Used, Allocation)
- Admins Emailed (Used, Allocation)
- Message Body Data Sent (Used, Allocation in GBytes)
- Attachments Sent (Used, Allocation)
- Attachment Data Sent (Used, Allocation in GBytes)
- UrlFetch API Calls (Used, Allocation)
- UrlFetch Data Sent (Used, Allocation in GBytes)
- UrlFetch Data Received (Used, Allocation in GBytes)
- Image Manipulation API Calls (Used, Allocation)
- Data Sent to API (Used, Allocation in GBytes)
- Data Received from API (Used, Allocation in GBytes)
- Transformations executed (Used, Allocation)
- Memcache API Calls (Used, Allocation)
- Data Sent to API (Used, Allocation in GBytes)
- Data Received from API (Used, Allocation in GBytes)
- XMPP API Calls (Used, Allocation)
- XMPP Data Sent (Used, Allocation in GBytes)
- Recipients Messaged (Used, Allocation)
- Invitations Sent (Used, Allocation)
- Task Queue API Calls (Used, Allocation)
- Deployments (Used, Allocation)
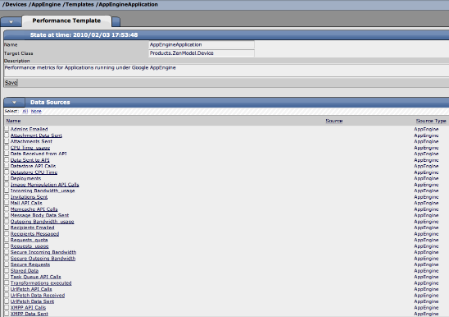
New metrics added by Google are automatically detected, although they will not be automatically added to the AppEngineApplication Template.
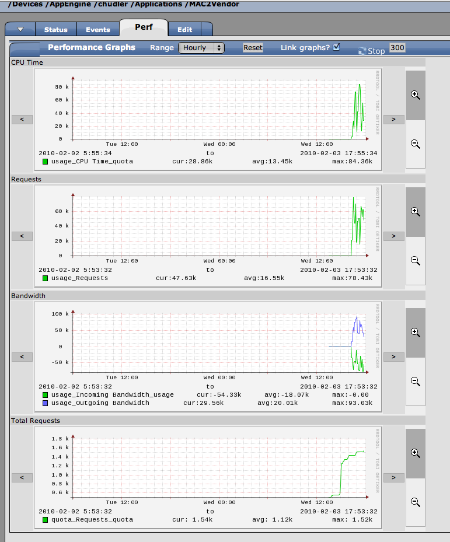
A few of these metrics are used to create 4 basic graphs (seen at the top of this document), but you should customize graphs and thresholds for your application's needs.
Source: http://zenpacks.zenoss.org/trac-zenpacks/browser/zenpacks/ZenPacks.chudler.GoogleAppEngine
Tagged Releases:
Change History:
- 1.0 initial release
Known issues:


