This is the third in a series of articles about writing an SSH-based ZenPack from scratch, the SSH ZenPack Development Tutorial Series. This series follows the development of the Mac OS X ZenPack.
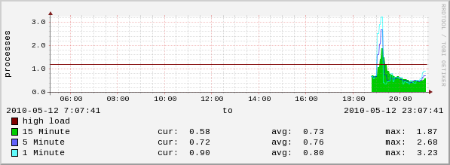
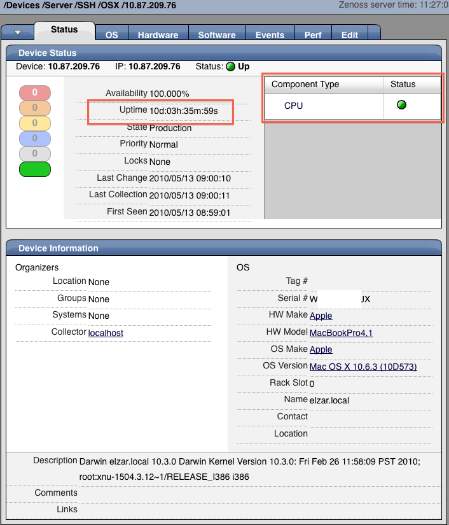
The 0.4 release of this ZenPack is the first that actually monitors, adding support for Uptime on the Status tab and the Load Average performance graph on the Perf tab. The changes for this release are mostly contained within the object.xml. Unlike the modeling plugins, there was not a need to write custom parsers for the data returned; the built-in uptime parser from Products.ZenRRD.parsers.uptime correctly parses the output from OS X's /usr/bin/uptime. The Device template is defined with an uptime Data Source, a high load Threshold and a Load Average Graph Definition. The Data Source pulls the following DataPoints with the uptime parser: laLoadInt1, laLoadInt5 (aliased to loadAverage5min), laLoadInt15, sysUpTime. The Threshold is set to a Warning severity at '1.2'. The Graph Definition graphs the Threshold and the 3 Data Points.
The directory structure has been updated, with changes marked in green:
- setup.py
- contains build information for the .egg, updated version number to 0.4
- COPYRIGHT.txt
- standard copyright file, GPLv2
- MANIFEST.in
- used by build to include everything
- ZenPacks/__init__.py*
- ZenPacks/community/__init__.py*
- ZenPacks/community/OSX/__init__.py
- creates the /Server/SSH/OSX device class
- registers the collector plugins (cpu, memory, software, uname_a)
- ZenPacks/community/OSX/modeler/__init__.py*
- ZenPacks/community/OSX/modeler/plugins/__init__.py*
- ZenPacks/community/OSX/modeler/plugins/zenoss/__init__.py*
- ZenPacks/community/OSX/modeler/plugins/zenoss/cmd/__init__.py*
- ZenPacks/community/OSX/modeler/plugins/zenoss/cmd/osx/__init__.py*
- ZenPacks/community/OSX/modeler/plugins/zenoss/cmd/osx/cpu.py
- modeler plugin that parses the output of:
system_profiler -detailLevel mini SPHardwareDataType
- ZenPacks/community/OSX/modeler/plugins/zenoss/cmd/osx/memory.py
- modeler plugin that parses the output of:
system_profiler -detailLevel mini SPHardwareDataType | grep Memory
- ZenPacks/community/OSX/modeler/plugins/zenoss/cmd/osx/software.py
- modeler plugin that parses the output of:
system_profiler SPApplicationsDataType | sed '/Kind:/d' | sed '/64-Bit (Intel):/d' | sed '/^$/d' | sed 's/\©/\(c\)/g'
- ZenPacks/community/OSX/modeler/plugins/zenoss/cmd/osx/uname_a.py
- modeler plugin that parses the output of:
uname -a && system_profiler SPHardwareDataType | grep 'Serial Number (system)' && system_profiler -detailLevel mini | grep 'Model Identifier' && system_profiler -detailLevel mini SPSoftwareDataType | grep 'System Version'
- ZenPacks/community/OSX/objects/objects.xml
- adds the zCollectorPlugins (lines 5-7) (cpu, memory, uname_a, software)
- updates zFileSystemMapIgnoreTypes to ignore 'devfs' and 'map' filesystem types (lines 8-10), not used yet
- Device template (starts line 16)
- uptime Data Source (starts line 27)
- laLoadInt1, laLoadInt5, laloadInt15 Data Points (starts line 54)
- high load Threshold (starts line 96)
- Load Average Graph Definition (starts line 170)
- Graph Points (starts line 197)
- ZenPacks/community/OSX/tests/__init__.py*
- ZenPacks/community/OSX/tests/parserdata/osx/elzar/uptime
- shell command and output for a 10.6 machine's
/usr/bin/uptime
- ZenPacks/community/OSX/tests/parserdata/osx/elzar/uptime.py
- results from the uptime parser running against the uptime test data
- ZenPacks/community/OSX/tests/parserdata/osx/ndnd/uptime
- shell command and output for a 10.5 machine's
/usr/bin/uptime
- ZenPacks/community/OSX/tests/parserdata/osx/ndnd/uptime.py
- results from the uptime parser running against the uptime test data
*unless noted, the __init__.py files are empty |
For using this ZenPack:
- Download the ZenPack from the Mac OS X page or to build the ZenPack: make ZenPacks.community.OSX
- Install the ZenPack
- zopectl restart; zenhub restart
- Browse to the newly created /Server/SSH/OSX device class
- You can run the unit tests against with: runtests ZenPacks.community.OSX
Add an OSX device to the /Server/SSH/OSX device class with the zCommandUsername and zCommandPassword set or the zKeyPath
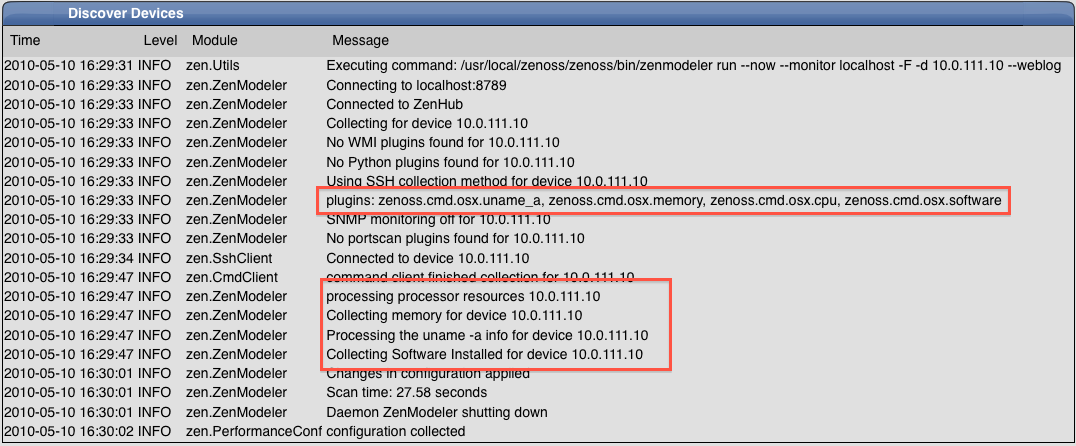
- Model the device

- Wait approximately 10 minutes and navigate to the Status Tab:

- Navigate to the Perf Tab:
