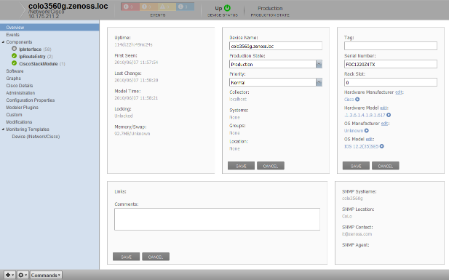
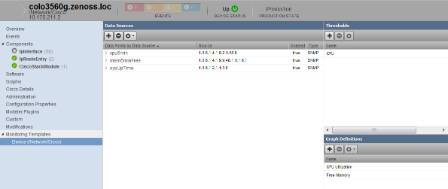
To view details for a single device, click its name in the device list. The device overview page appears.
Event status is shown in the "event rainbow" at the top of the page. Other key information that appears at the top of the device overview page includes:
Device name
IP address used to communicate with the device
Device status (shows the current results of a ping test)
Production state (Pre-Production, Production, Test, Maintenance, or Decommissioned)
When you open the page, device overview information displays. This view provides classification and status information. From here, you can edit device information (indicated by text fields or edit links).
The Links area displays links between the device and other external systems. For more information about custom links, see the chapter titled "Properties and Templates."
The left panel of the device overview page allows you to access other device management views, such as:
Information that appears here varies depending on device type.
Detailed information about events, scoped to the device, appears in the Events view. From here, you can:
Sort event information by a range of categories
Classify and acknowledge events
Filter events by severity, state, or by one of several categories
The Components view provides information about the different types of device components, including:
IPService
WinService
IpRouteEntry
IpInterface
CPU
FileSystem
To access components information, select Components in the left panel, and then select a component type.
The status of each device component type, as shown by the color of its indicator, is determined by the collective status of the monitored components of the same type. For example, if the IpService status is green, then all monitored IpServices on the device are functioning normally. If there is an event related to a monitored IpService, then the highest severity event associated with that component is displayed.
Note
If there is an event unrelated to a known component, then the system places it in the component type Other.
From this view, you can:
Lock components
Turn on or off component monitoring
Delete components
The Software view lists software installed on the device. The details provided in this area depend on the method used to model the device.
Listed software links into the system's inventory of software in your IT infrastructure. You can view this inventory from the Manufacturers link on the sub-navigation menu.
To access software information, select Software in the tree view.
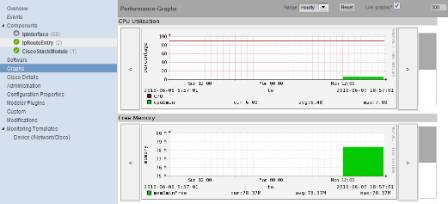
The Graphs view shows performance graphs defined for the device. To access graphs, select Graphs in the left panel.
Tip
You can use the arrow key and magnifying glass controls on the sides of each graph to change the graph view, scrolling through or zooming in or out of a graph.
You can control these performance graph options:
Range - Select the span of time displayed in the graph. You can select:
Hourly - Past 36 hours
Daily - Past ten days
Weekly - Past six weeks
Monthly - Past 15 months
Yearly - Past two years
Reset - Click to return to the default (initial view) of the graphs.
Link graphs - By default, all graphs move together. If you click the back arrow for a graph, for example, then all graphs move backward. De-select the Link graphs option to control each graph individually.
Stop/Start - Toggle to turn off and on automatic refresh of the graphs. Optionally, modify the refresh value (by default, 300 seconds), and then click Stop/Start to begin refreshing graphs at the new interval.
For more information about performance monitoring and performance graphs, see the section titled "Performance Monitoring."
Use the Administration view to:
Create custom user commands and run commands
Manage maintenance windows
Determine who holds administration capabilities for the device, and their roles
To access administration options, select Administration in the left panel.
See these topics for more information about device administration tasks:
"Defining User Commands" in the chapter titled User Commands
"Adding Administrators" in the chapter titled Managing Users
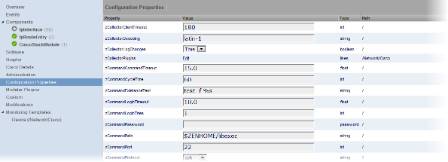
From the Configuration Properties view, you can configure certain configuration properties for a device. Further, you can delete local properties from a device.
To access configuration properties, select Configuration Properties in the left panel.
For detailed information about working with configuration properties, see the chapter titled "Properties and Templates."
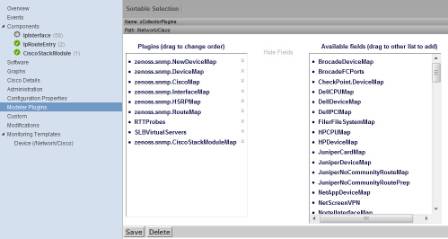
Use the Modeler Plugins view to manage plugins that are run against a device. To access plugins, select Modeler Plugins in the left panel.
Use the Custom view to edit the values of custom properties applied to a device.
To access custom device properties, select Custom in the left panel.
You cannot define custom properties on an individual device. See the section titled "Adding Custom Properties" for more information.
The Modifications view shows changes made to a device. The list shows when the change was made and the user who made the change. To access this information, select Modifications in the left panel.
Monitoring templates determine how the system collects performance data for devices and device components.
To access monitoring templates, expand Monitoring Templates in the left panel, and then select Device. The page shows all of the monitoring templates that are bound by name to this device.
For detailed information about monitoring templates, go to the section titled "Performance Monitoring."


