Archived community.zenoss.org | full text search
Skip navigation
46179 Views 4 Replies Latest reply: Dec 31, 2009 11:07 AM by smcingvale RSS
smcingvale Rank: White Belt 20 posts since
Dec 1, 2009
Currently Being Moderated

Dec 27, 2009 3:16 PM

BlueCoat ZenPack Graphs not showing

I installed the BlueCoat ZenPack (docs/DOC-3381) to monitor some BlueCoat SG's.  The intall was successful and I've added a few devices under the /devices/network/BlueCoat organizer.  Everything seems to be fine except I don't see any graphs when I click the 'perf' tab for these devices.  When checking the actual Bluecoat-stats template there is a number of graph definitions.  Why don't I see any of the graphs under devices modeled as /network/bluecoat and where can I look to debug this issue?


Thanks.

  • Matt Ray Rank: Zen Master 2,484 posts since
    Apr 5, 2008
    Currently Being Moderated
    1. Dec 29, 2009 5:15 PM (in response to smcingvale)
    Re: BlueCoat ZenPack Graphs not showing
    Hmmm... I wonder if there is a template defined on the BlueCoat organizer that isn't bound by default?  Check to verify that there aren't any custom templates that aren't bound.  When they are they'll show up on the Perf tab.
  • jmp242 ZenossMaster 4,060 posts since
    Mar 7, 2007
    Currently Being Moderated
    3. Dec 30, 2009 4:17 PM (in response to smcingvale)
    Re: BlueCoat ZenPack Graphs not showing

    Yes, but is the template bound to the class/devices? Look in zProperties

    under zDeviceTemplates ... is the Bluecoat template there? If not, it's

    not bound. You can either add the exact name in a new line there and

    save, OR, go to Templates, dropdown, Bind Templates. CONTROL-CLICK so

    each template you want to apply is highlighed Blue (DO NOT UNBIND

    DEVICE Accidentally for instance) and click save.

    --

    James Pulver

    Information Technology Area Supervisor

    LEPP Computer Group

    Cornell University


    smcingvale wrote, On 12/30/2009 10:33 AM:

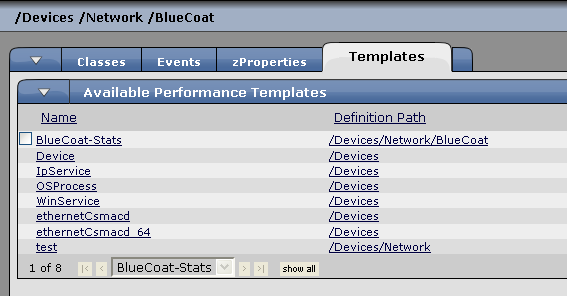
    Not sure I follow.  What do you mean they'll show up in the perf tab when bound?  As graphs?  Because nothing shows up right now.  However, it looks like the following templates are part of the /Devices/Network/Bluecoat organizer.  Specifically, the BlueCoat-Stats template has all the data sources I want (it also has graphs for those data sources).


      Image:BlueCoat.bmp  (servlet/JiveServlet/showImage/1996/BlueCoat.bmp)


    The problem seems to be that Zenoss isn't collecting the Data Sources in the BlueCoat-State template.  I have 2 devices under /Devices/Network/Bluecoat.  When I browse to them under $ZENHOME/perf/Devices and ls this is what I see:


    Re: BlueCoat ZenPack Graphs not showing  # ls

    os  sysUpTime_sysUpTime.rrd


    So, my guess is for some reason Zenoss isn't collecting the data in the BlueCoat-State template?  Since thre's no data the graphs don't show up under the perf tab.  How can I debug why Zenoss isn't collecting this data?  Do I have to do something else to get this to work?

    >

More Like This

  • Retrieving data ...

Legend

  • Correct Answers - 4 points
  • Helpful Answers - 2 points