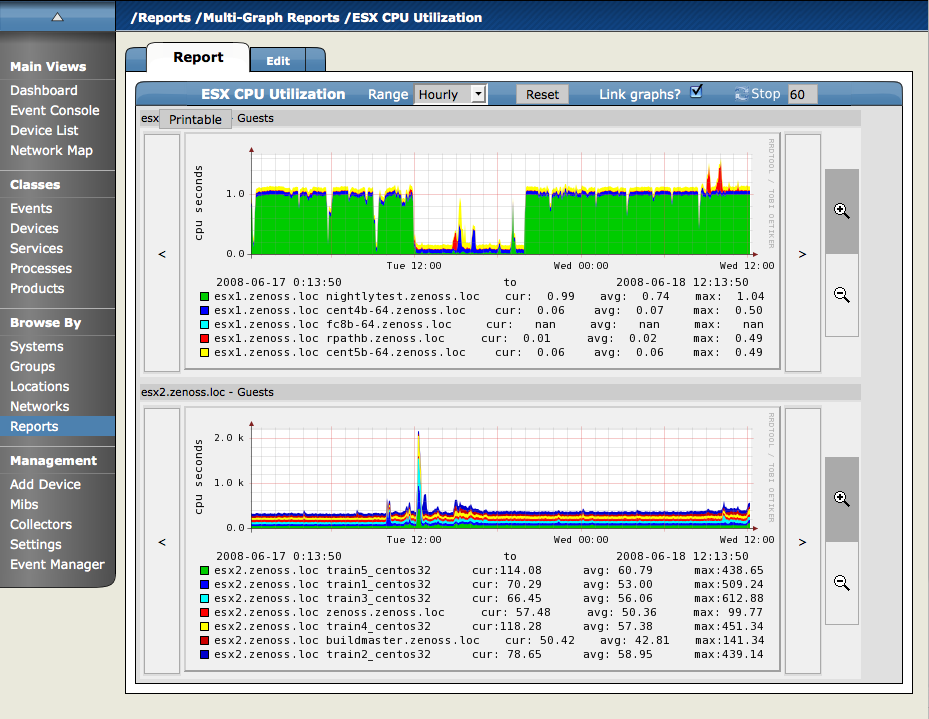
#7. MultiGraph Reports
MultiGraph Reports are a powerful mechanism for combining data from different Devices and Components into a single report. You can create a Graph Definition and have it drawn once for each in a group of Devices and Components that you define. Alternatively, you can have the data for those graphs combined into a single graph. The Graph Definitions are very similar to those used in Performance Templates except that these are defined and used exclusively within a single report. The groups of Devices and Components you assemble are called Collections. Specifying which Graph Definitions to apply to which Collections is done through Graph Group objects. Like Graph Reports, MultiGraph Reports have two different views, normal which looks similar to Device and Component graph pages and printable which is formatted more suitably for printing. The normal view is seen on the Report tab of any MultiGraph Report. At the top right of that view is a button named Printable for displaying the printable version.
MultiGraph Reports include their own Graph Definitions and thus do not use the Graph Definitions that are defined within Performance Templates. If you want to create a report that includes graphs defined on Templates then you may wish to use GraphReports rather than MultiGraph Reports.
#7.1. Creating A MultiGraph Report
From within the MultiGraph Reports organizer or a sub-organizer use the Add MultiGraph Report menu item to create a new report. After entering a name for the new report you will be taken to the edit page. The fields for a MultiGraph Report are:
Name - The name of the report is displayed at the top of the report.
Title - This is displayed at the top of the printable version of the report.
Number of Columns - The report will display the graphs in this many columns on the report.
Once you've created the MultiGraph Report there are three steps required to get graphs showing on the report:
Create a Collection which contains the Devices and/or Components you want to graph.
Create a Graph Definition that describes the graph(s) you want on the report.
Create a Graph Group which specifies the Collection and the Graph Definition you just created. The Method setting in the Graph Group lets you choose to have the graph drawn once for each Device/Component in the Collection or you can have the data from all the Devices/Components combined into a single graph.
These are just the minimal steps to getting a functional MultiGraph Report. You can create any number of Collections, Graph Definitions and Graph Groups in a single report. See the sections that follow for details on creating Collections, Graph Definitions and Graph Groups.
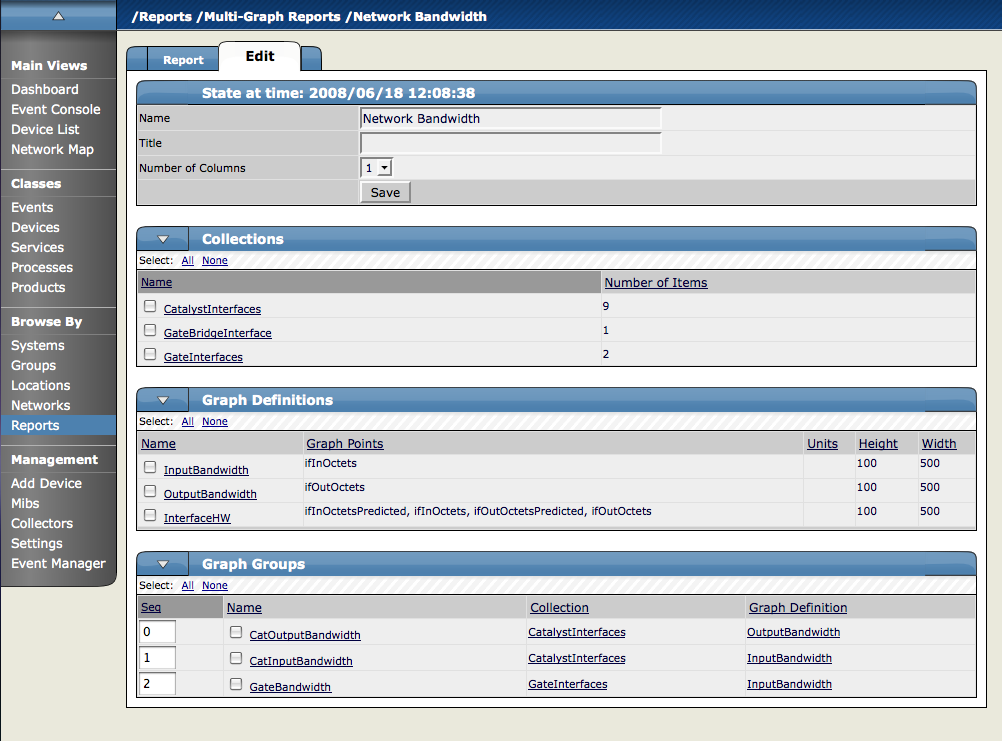
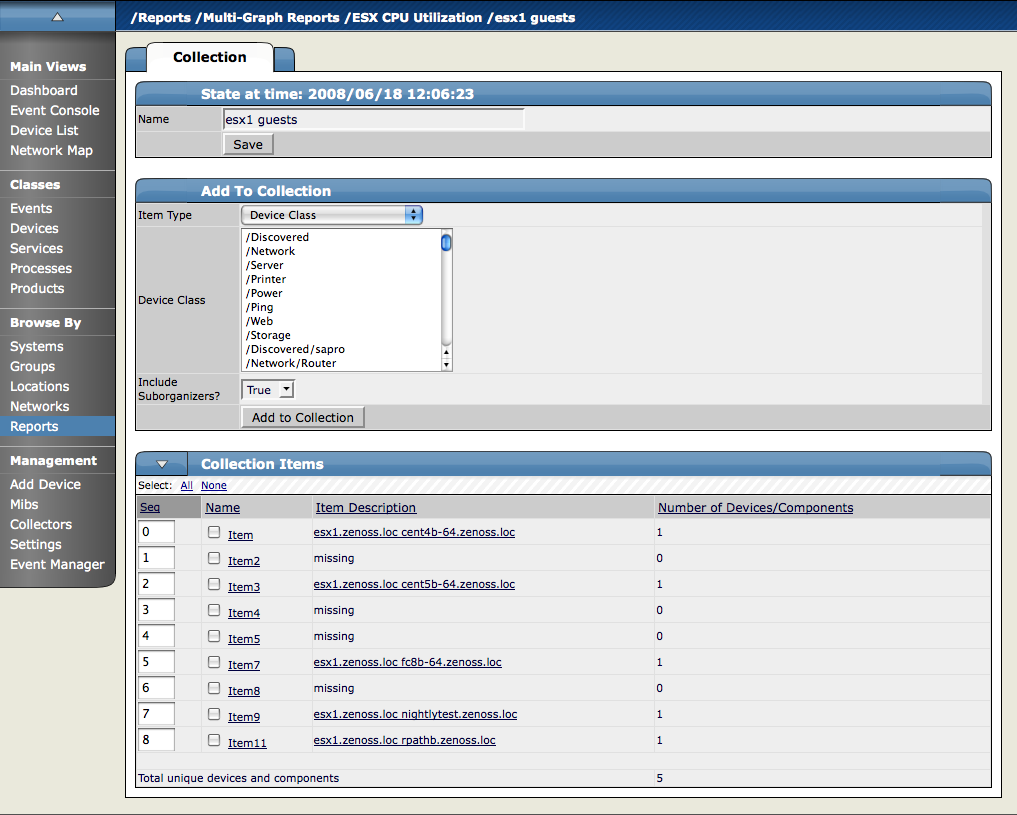
#7.2. Collections
A Collection is a group of Devices and/or Components. A MultiGraph Report must have at least one Collection. Collections are listed in the Collections table on the report's Edit page. You can create a new Collection with the Add Collection menu item on that table then specifying a name in the dialog that appears.
A Collection consists of one or more Collection Items. A Collection Item is a list of Device Classes, Systems, Groups, Locations or specific Devices and Components that should be included in this Collection. You can create as many Collection Items of the various types as you wish within a single Collection. The controls for creating Collection Items are in the Add To Collection table of the Collection edit page. The Item Type menu lets you select one of the following:
Device Class/System/Group/Location - Selecting one of these options reveals a list of all organizers of that type. You can select one or more of the organizers to include in the Collection. By selecting True for the Include Suborganizers field the Collection will also include all organizers recursively beneath the ones you selected. These Collection Items are dynamic - when devices are added or removed from these organizers they will appear or disappear from the report. Clicking the Add to Collection button creates a new Collection Item for each of the selected organizers.
Specific Device/Component - Selecting this type reveals a list of all Devices in Zenoss. You can use the Filter field to narrow this list by entering a full or partial Device name. Selecting one or more Devices will display a list of Component names that apply to one or more of the selected Devices. If you do not select any Components and click the Add to Collection button then a new Collection Item is created for each selected Device.
Once you have specified an Item Type and made your selection click the Add to Collection button to create the new Collection Item. It will be added to the list of Collection Items at the end of the page. Collection items can be deleted or reordered within this list. Order of the Collection Items determines the order that the graphs are drawn in or the order that data is drawn on a combined graph. See the section on Graph Groups for more details.
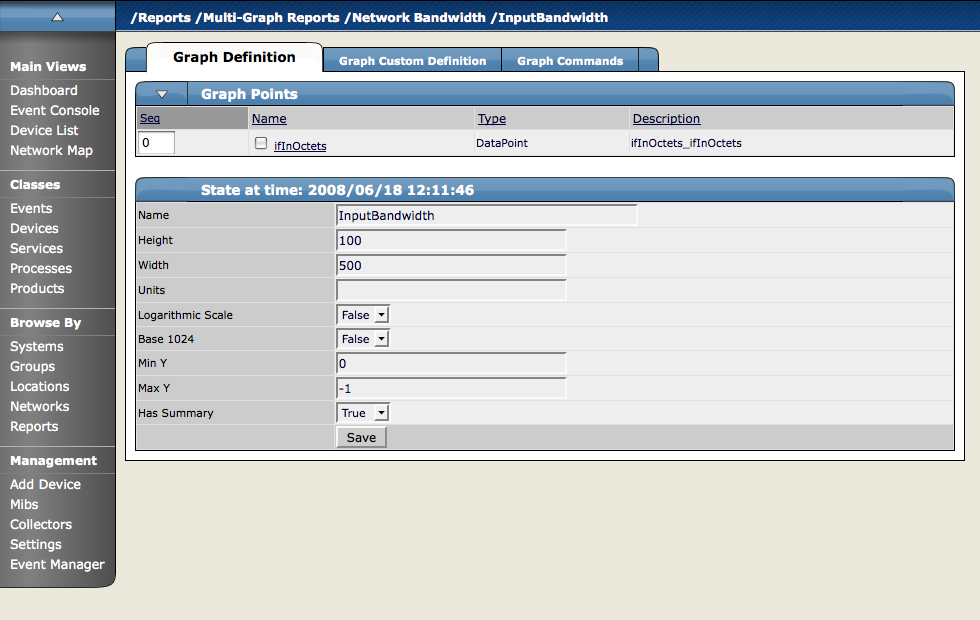
#7.3. Graph Definitions
Graph Definitions in the context of MultiGraph Reports are very similar to those in Performance Templates. Settings on the Graph Definition itself define some basic parameters, then you add Graph Points to specify which data should be drawn. See the section on Graph Definitions in the Performance Chapter for details on creating Graph Definitions.
The most significant differences between Graph Definitions in the two contexts is how DataPoint Graph Points and Threshold Graph Points are added. When adding a DataPoint Graph Point to a Graph Definition within a Performance Template you can select from a list of DataPoints that are defined on that Template. But within the context of a MultiGraph Report there are no GraphPoint definitions to list. So instead of listing the available DataPoints, the DataPoint Graph Point dialog has a text field where you enter the name of the DataPoint. To make things easier the input has an auto-complete feature which knows the names of every DataPoint defined in Zenoss. This same situation is true with Threshold Graph Points.
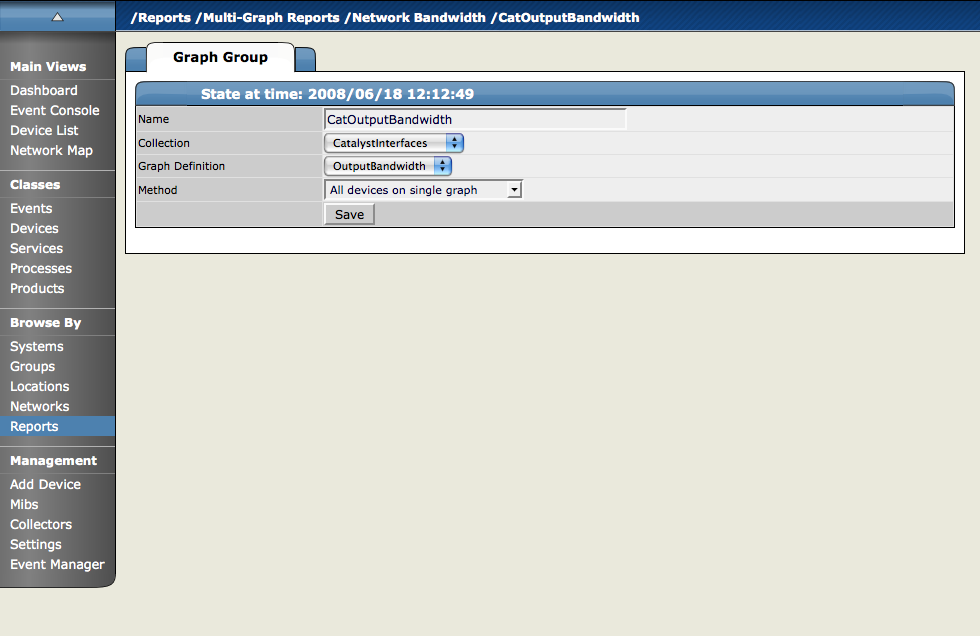
#7.4. Graph Groups
Graph Groups are used to combine one Graph Definition with one Collection to produce graphs for the report. You must have at least one Graph Group or your report will have no graphs. You create a new Graph Group by selecting the Add Group menu item from the Graph Groups table menu. After entering a name for the Graph Group you are presented with the Graph Group edit page. There are 4 settings on this page:
Name - This is used to identify the Graph Group on the MultiGraph Report page. It does not appear anywhere on the actual report.
Collection - Select one of the Collections that have been defined for this report.
Graph Definition - Select one of the Graph Definitions that have been defined for this report.
Method - There are two options for applying the Graph Definition you selected to the Collection that you selected: * Separate graph for each device: The Graph Definition will be used to draw one graph for each Device and Component listed in the Collection. The graphs will appear in the list in roughly the same order they are specified within the Collection. * All devices on a single graph: This draws one graph with the data from all the Devices/Components on it.
#7.5. Graph Order
Graph Groups are drawn in the order they are listed on the MultiGraph Report edit page. You can change the order of the Graph Groups by editing the sequence number next to each then using the Re-Sequence Items menu item from that table's menu. If a Graph Group results in multiple graphs, the graphs are drawn in the order that the Collection Items are listed within the corresponding Collection. If a Collection Item specifies a Device organizer then the order of the Devices drawn from that Collection Item is indeterminate.
As with Graph Reports, if you have specified multiple columns for a report then the graphs are drawn left to right in that number of columns using as many rows as necessary.
