#3. Monitoring Using ZenCommand
Read the following sections for more information about monitoring using ZenCommand.
#3.1. About ZenCommands
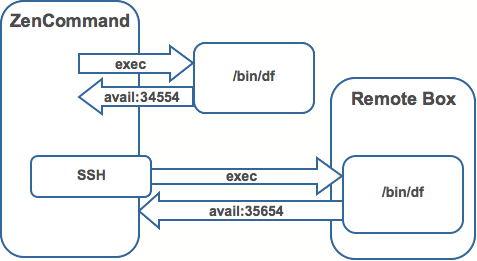
Zenoss has the ability to run Nagios® and Cactii plug-ins though the ZenCommand process. ZenCommand can run plugins locally and remotely by using a native SSH transport. When run, Zenoss tracks the return code of each plug-in and then creates events with plug-in output. Additionally, Zenoss can track performance information from a plug-in.
#3.2. Example: Writing a ZenCommand (check_http example)
You can use a ZenCommand plugin (check_http) to check for specific content of a Web page. (This implicitly checks for server/page 200 status as well.)
The following example procedure shows how to set up a ZenCommand plugin to check specific content. The steps show how to test the plugin, and then integrate it with Zenoss.
As the zenoss user, test the plugin from the command line. Enter the following command to test the product directory:
$ZENHOME/libexec/check_http -H www.zenoss.com
If the check_http command is correct, the output will look similar to the following.
HTTP OK HTTP/1.0 200 OK - 0.723 second response time |time=0.722758s;;;0.000000 size=7932B;;;0
Note
The
check_http -hcommand displays all plugin options.Add the device you want to check (one running a "www" Web site) to the Zenoss system, setting the discovery protocol to "none."
Navigate to the device in Zenoss, and then select More > Templates from the page menu.
Click Create Local Copy.
The default device template is overridden with the device template specific to this device.
In the template, remove the sysUpTime data source. (In this example, SNMP is not used for the device.)
Add a new description to the template.
Add a new data source called rootWebCheck.
In the rootWebCheck data source, set the following variables:
Source Type = COMMAND
Component = rootWebCheck
Cycle Time = 30
Debug your ZenCommand by running zencommand in the foreground with debugging on:
zencommand run -d www.website.com -v10Where www.website.com is the site you want to monitor.
The command template field is a TALES expression. You can make substitutions in the command that will make it generic for any device added to this class.
Set the
-Hflag to the IP of the device against which this command will be run, as follows:check_http -H ${here/manageIp}Add a check looking for content on the page. The
-rflag will run a regular expression against the Web page to check for text.check_http -H ${here/manageIp}-r textstring1Where textsrting1 is text you know is on the resulting Web page.
For this example, the command should be generic. Make a custom field for the regex that can be changed per device. Set the default to “.*”, which will match everything. Go to /Devices/Custom Schema and add a new field:
Label = Web Match Regex
Name = cWebMatchRegex
Type = string
Default = .*
Visible = True
Return to the template and change the command to be.
check_http -H ${here/manageIp}-r ${here/cWebMatchRegex}Add the regex value into cWebMatchRegex (used in the example above).
Test the ZenCommand from the command line.
#3.3. Example: Collect Data from A ZenCommand
To collect and display data from the ZenCommand check_http example, you can log the data to see something like response time in a graphical format.
Navigate to /Web/Device template.
Go to the data source created in the check_http example.
In the Data Points table, add a data point named "time." (No modifications are needed to the data point.)
Test the command again. You should see a log message that starts with:
DEBUG:zen.zencommand:storing responseTime = 1.0
Make a graph to display the data. In the device template, create a graph called “Web Response Time."
For this graph, set the following values:
Data Sources = rootWebCheck_responseTime
Units = Seconds
Min Y = 0
View the Perf tab for the device www.website.com (the Web site you were using to check) to see the graph. Graph data will not appear until collection is run several times. Restart zencommand so that the new configuration takes effect immediately.
#3.4. Plugin Format for ZenCommands
Nagios® plugins are configured by using a command template that is much like the RRDTemplates used for performance monitoring.
A template named “Device” will bind to all devices below the template definition. Within each template is a list of commands that will run. The commands can be any program that follows the Nagios® plug-in standard. Inputs are command line arguments; output is the first line of stdout, plus a return code.
For complete information about Nagios plugin guidelines, browse to this location:
http://nagiosplug.sourceforge.net/developer-guidelines.html
A Nagios® command has several fields:
name – Specifies the name of the command object.
enabled – Indicates whether this command should be used on a given device.
component – Specifies the component name to use when zencommand sends events to Zenoss.
event class – Specifies the event class to use when sending events to Zenoss.
severity – Sets the default severity to use when sending events to Zenoss.
cycle time – Sets the frequency a command should be run (in seconds).
command template – Specifies the command to run.
The command template string is built by using Zope TALES expressions. Several variables are passed when evaluating the template. They are:
zCommandPath – Path to the zencommand plug-ins on a given box it comes from the zProperty zCommandPath. zCommandPath is automatically added to a command if a path is absent from the beginning of the command.
devname – Device name of the device against which the command is being evaluated.
dev – Device object against which the command is being evaluated.
here – Context of evaluation. For a device, this is equivalent to dev for a component (such as a filesystem or interface). This is the component object.
compname – If this command evaluates against a component, specifies its name as a string.
now – Current time.
Template values are accessed like shell variables. They are the same as the expression syntax used in the appendix titled TALES Expressions (in this guide).
#Examples
Run an http check against all devices by using the URL /zport/dmd:
check_http –H ${devname}-u /zport/dmdIn a template named FileSystem, the following command will run against all file systems on a device:
check_disk –w 10% -c 5% -p ${compname}
#3.5. Testing ZenCommands
You can test ZenCommand data sources by using the zentestcommand shell script.
From the command line, run:
zentestcommand –d DeviceName --datasource=DataSourceName
where DeviceName is the device on which you want to run the command, and DataSourceName is the name of a data source on a template associated with the device.
The zentestcommand script prints the results of the command to standard output.
