#1. Zenoss Interface and Navigation
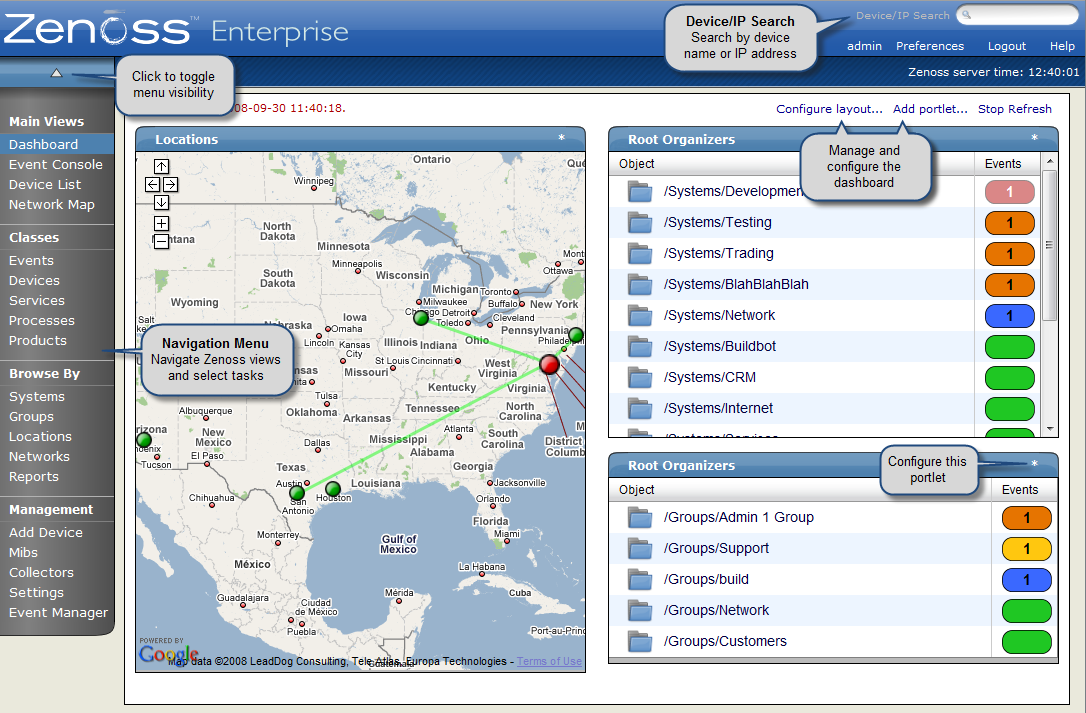
After you install Zenoss and navigate to the interface from your Web browser, the Zenoss Dashboard appears. The Zenoss Dashboard provides at-a-glance information about the status of your IT infrastructure. It is the primary window into devices and events that Zenoss enables you to monitor.
The Dashboard can show:
Important error-level device events
Geographical high-level view
"Troubled" devices
Key Dashboard and interface areas include:
Navigation menu
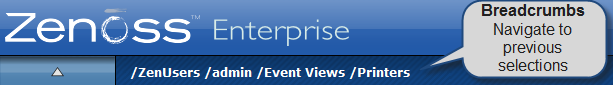
Breadcrumbs
User information area
Portlets
Zenoss Network Map
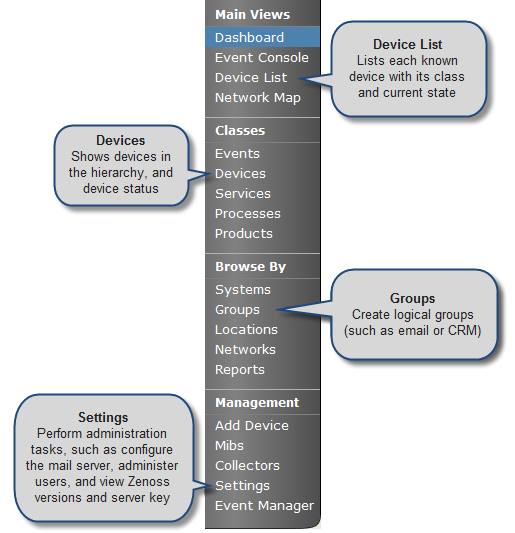
#1.1. Navigation Menu
The Navigation menu lets you access most of the Zenoss' features. The menu is divided among several functional areas:
Main Views, which includes these selections:
Dashboard - Returns you to the primary view.
Event Console - Shows a list of all current events in the event database.
Device List - Shows a list of all devices in Zenoss.
Network Map - Shows a graphical representation of the devices in your network.
Classes, which includes these selections:
Events - Links to the event management area, where you can monitor event status, events, history, zProperties, and event transforms. You also can track changes made to events.
Devices - Lets you manage sub-devices and a summary of events by severity. Allows you to view events sorted by severity, followed by device name, history of device events, PerfConfig, zProperties for devices, and recent device changes.
Services - Allows you to show service classes, administer commands on a service basis, access zProperties, and track changes made to services monitoring.
Processes - Lets you create new process groupings and add processes to monitor.
Products - Shows a list of all manufacturers of devices in the Zenoss database.
Browse By, which lets you see data based on any of the local groupings Zenoss enables you to create. Selections include:
Systems - Lets you see network status, categorized into the system groupings you create.
Groups - Provides access to the same data as when browsing by Systems, with the exception of performance data.
Locations - Allows you to see data related to devices grouped by physical locations.
Networks - Shows devices and sub-networks, based on IP address groupings.
Reports - Lets you view and define reports in Zenoss.
Management, which includes:
Add Device - Add devices to Zenoss.
MIBs - Add and manage MIBs in Zenoss.
Collectors - Add collectors to Zenoss for better performance and scaling when the device count is too large for one collector.
Settings - Manage other Zenoss settings, such as dashboard production state, state conversions, and administrative roles.
Event Manager - Lets you view and manage the event cache.
The following figure illustrates key selections from the Navigation menu.
#1.1.1. Hiding the Menu
Click the triangular indicator at the top of the Navigation menu to hide or display menu selections.
#1.1.2. Pinning the Menu
Click the pin icon to "pin" the menu into place, keeping it visible in all views.
#1.2. Breadcrumbs
The breadcrumbs area shows your current location in Zenoss. Use this trail to keep track of your location and navigate to previously selected pages in the interface hierarchy.
#1.3. User Information Area
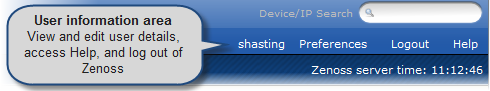
The User information area offers information and selections:
Login ID - The ID of the user currently logged in to Zenoss appears at the far left of this area.
Preferences - Click to edit user settings, such as authentication information, roles, and groups. (You also can access user settings from the Navigation menu Settings selection.)
Note
From other Preferences tabs, you can manage administered objects, event views, and alerting rules.
Logout - Click to log out of Zenoss.
Help - Click to access Zenoss community product documentation, FAQs, and HowTos, at:
#1.3.1. Update Details
The date and time that Zenoss was last updated appears below the Preferences link. Every 60 seconds, Zenoss polls for new data and refreshes the data fields. If the poll fails, then Zenoss displays the message:
Lost Connection to Zenoss
#1.4. Portlets
The main content of the Dashboard comprises portlets, which provide information about the system and your infrastructure. Portlets that you can display on the dashboard are:
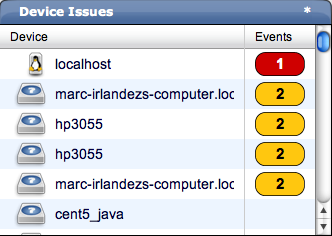
Device Issues - Displays a list of devices, associated with color-coded events of error or critical severity levels. Click a device in the list to view its event log.
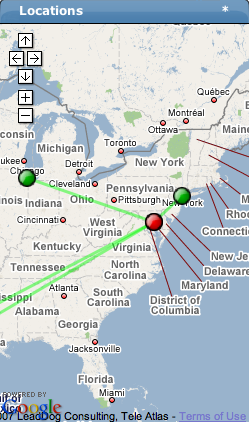
Google Maps (device locations) - Shows configured locations and configured network connections.
Zenoss Issues - Contains system self-monitoring information.
Production States - Shows devices assigned to a particular production state.
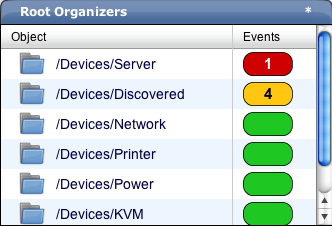
Top Level (Root) Organizers - Lists status for each grouping in your defined Zenoss hierarchy.
Object Watch List - Allows the display of high-level status device classes, groups, systems, event classes, and locations that you select.
#1.4.1. Customizing Portlets
You can customize each portlet that appears on the Dashboard. Customization options vary depending on the portlet type.
Click * (asterisk), which appears at the top right corner of a portlet, to view and customize display options. Click Save Settings to save your selections and then return to main portlet content.
The following table lists information you can customize for each Zenoss portlet.
| For this portlet type.. | ...you can customize: |
|---|---|
| Device Issues | Title, Refresh Rate |
| Google Maps | Title, Refresh Rate, Base Location |
| Zenoss Issues | Title, Refresh Rate |
| Production States | Title, Refresh Rate, Production States (to appear on the Dashboard) |
| Top Level (Root Organizers) | Title, Refresh Rate, Root Organizer (to appear on the Dashboard) |
#1.5. Zenoss Network Map
The Network Map represents your network's Layer 3 topology. From the map, you can quickly determine the status of each device by its background color.
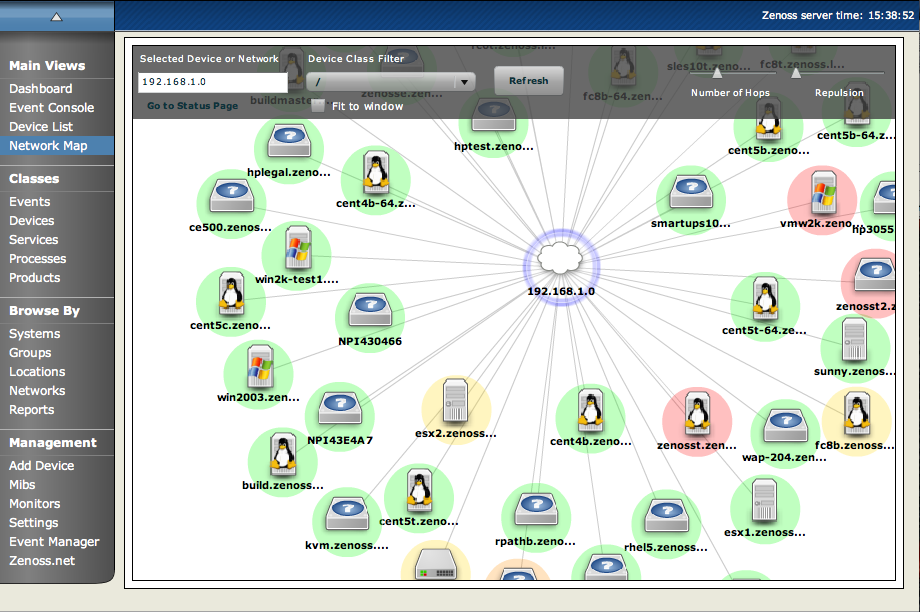
#1.5.1. Viewing Device and Network Details
Double-click a device or network icon in the map to focus on it. Focusing on a node:
Centers it on the map
Shows links from the node, based on the number of hops selected
Alternatively, you can type the name or IP address of a device or network in the Selected Device or Network field, and then click Refresh to focus on that node.
Note
When you select a node, the network map displays only the links that are currently loaded into the map. It does not download and display new link data.
#1.5.2. Loading Link Data
To load link data for a node:
Double-click the node on the map to focus on it, or enter the device name or IP address in the Selected Device or Network field.
Select the number of hops to download and display.
Click Refresh.
#1.5.3. Filtering by Device Type
You can filter the devices that appear on the network map. To do this, select a filter from the Device Class Filter list of options. For example, to show only Linux devices on the map, select /Server/Linux from the list of options, and then click Refresh.
#1.5.4. Adjusting Viewable Hops
You can adjust the number of hops that appear on the network map. Use the Number of Hops slider, which adjusts the number of hops from 1 to 4.
#1.5.5. Adjusting the Network Map
Use the Repulsion slider to expand or contract the icons that appear on the map. Move the slider right to expand the icons, or left to contract them.
Select the Fit to Window option to bring all displayed icons into the viewable area.
#1.5.6. Viewing Device or Network Details
To see detailed information about a device or network, select it in the map, and then click Go to Status Page.
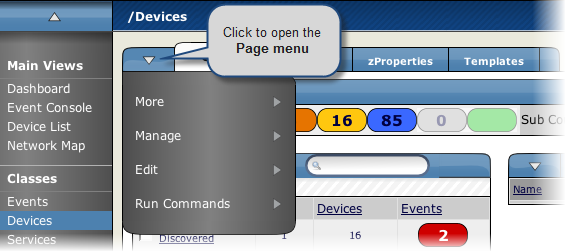
#1.6. Zenoss Menus
Zenoss offers two types of menus from which you make selections:
Page menus
Table menus
#1.6.1. Page Menus
Page menus extend the tabs that appear at the top of the page. Generally, actions initiated through a page menu affect the object or objects that the page represents. This could be, for example, a device or any group of devices.
As shown in the following figure, the Page menu is expanded next to the Classes tab.