#1. Availability Monitoring
The availability monitoring system within Zenoss provides active testing of the IT Infrastructure. The system currently consists of ZenPing, Zenoss’ Layer-3 aware topology-monitoring daemon, and ZenStatus, a TCP status tester.
ZenPing is configured automatically. ZenPing does the high-performance asynchronous testing of the ICMP status. The most important element of this daemon is that Zenoss has built a compete model of the your routing system. If there are gaps in Zenoss’ routing model, the power of ZenPing’s topology monitoring will not be available. If there are these gaps, this issue can be seen in the zenping.log file.
Zenmodeler goes out and discovers the routes to each device in the Zenoss network. Zenoss tries not to use Internet routing tables and prefers to rely on Zenmodeler to discover the relationships on its own and create its own network map.
Basically if any known route is broken, there will only be one ping event that is generated by the outage. Any additional outages beyond that will only flag that device and the next time a ping sweep occurs the errors beyond the known router will not occur.
This monitoring model breaks down if the routers do not share their routing tables and interface information.
#1.1. Controlling the Ping Cycle Time
Follow these steps to set up the ping cycle time.
From the left Navigation menu, select Monitors and select the Status monitor localhost and click the localhost link.
Notice the list of machines being pinged by this monitor.
In the “Edit” tab, change “Cycle Interval” to the desired interval.
On the next configuration cycle, the ping monitor will ping at the interval you set.
#1.2. Using the Predefined /Ping Device Class
The /Ping device class is an example of a configuration for devices that should only be monitored for availability. Zenoss will not gather performance data for devices placed under this class; it will only ping them. You can use it as a reference for your own configuration; or, if you have a device that you want be monitored for availability alone, you can place it under this class.
#1.3. Monitoring TCP Services
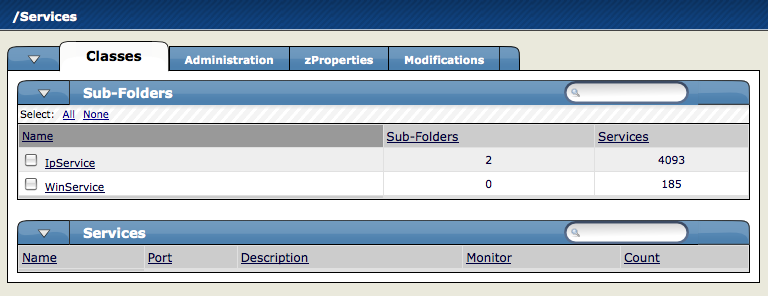
Use the Service menu to manage and monitor services that are running on your networks. To access the Services pages, from the left Navigational menu, choose Services. The Services Overview appears.
The Services overview shows the folders and sub-folders and lists all of the services that have been added to the system to monitor.
#1.3.1. ZenStatus
ZenStatus performs monitoring of TCP services. It is configured by turning on monitoring of a service under the “Services” root on the Navigation Toolbar. Service monitoring can be turned on a service class but this can be overridden on any service instance. For example, “SMTP” will be monitored by default but it may not be a critical service on all boxes. If this is the case, it may be removed on specific devices. Also, if the service is configured to only listen on localhost (127.0.0.1) the service will not be monitored.
#1.3.2. Adding a Service to Monitor
To add a service to monitor:
From the Services Overview page, in the Services text field, enter the name of the service you want to monitor.
Click the Add button.
The service appears in the Services list.
To set monitoring to True, click the Edit tab and set the Monitor pop-up to True. The service is now being monitored.
#1.3.3. Monitoring Status Service Status Information
To view the status information associated with a given service, select the service from the Services list in the Services Overview page.
The Individual Service Status tab appears.
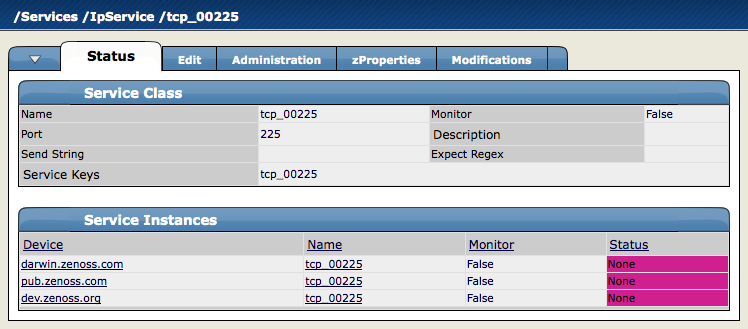
This tab shows you a summary of the details associated with this service. You can see the name of the service, whether its monitored or not, a Description, any associated Service Keys and a List of Devices where the service is currently running. To change any of this information, click the Edit tab.
#1.3.4. Editing Service Information
To edit the information that appears on the Individual Service Status tab, from the Individual Services page, click the Edit tab.
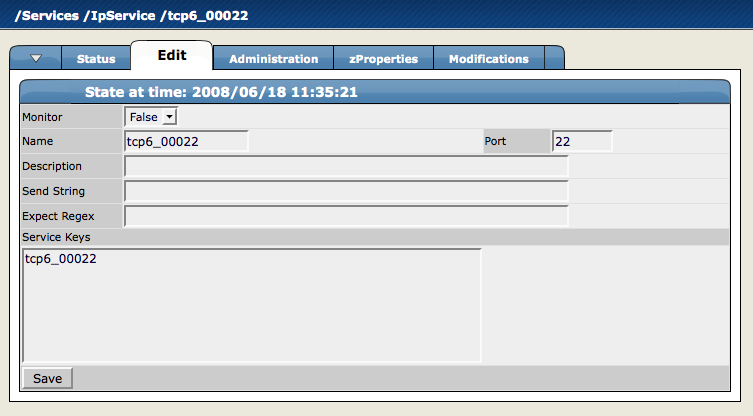
From this screen, use the Monitor pop-up to select True to monitor the service and False to not monitor the service. You can also add any associated Service Keys or enter a brief Description.
#1.3.5. Configuring Service zProperties
You can configure zProperties either for all services, for an individual service or for any services that fall further down in the service hierarchy tree. To configure them for all services click the zProperties tab from the Service Overview tab. To configure zProperties for an individual service, click on the service name in the Service Overview and then click the zProperties tab for that service. The Service zProperties Tab appears.
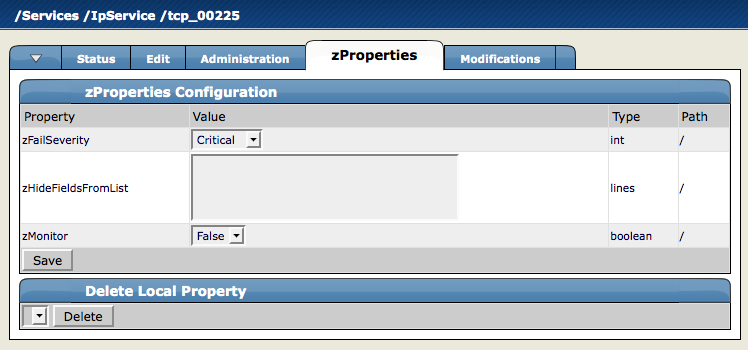
You can configure the following zProperties for an individual service from this tab:
ZFailSeverity
ZHideFieldsFromList
zMonitor
For more information about the Service zProperties, see the chapter titled "Properties and Templates."
#1.3.6. Using the Predefined /Server/Scan Device Class
The /Server/Scan device class is an example configuration for monitoring TCP services on devices using a port scan. You can use this device class as a reference for your own configuration; or, if you have a device that you want to be monitored for service availability alone, you can place it under this device class. Zenoss will not collect performance data for devices in this class.
#1.3.7. Monitoring a Service Using a Service Class
This section will show you how to set up monitoring of an IP service across a group of devices using a service class.
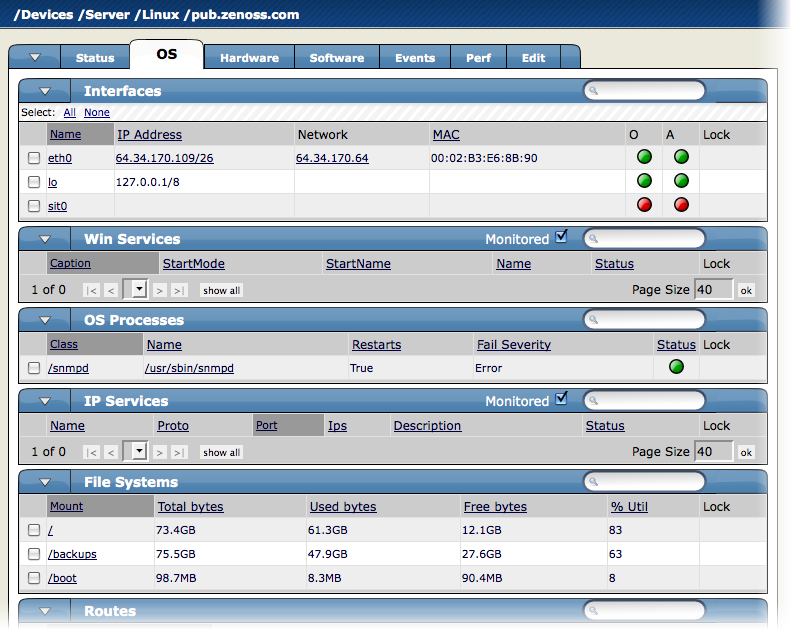
Navigate to the OS tab for a device you have loaded into the system.
The OS Tab for a device appears.
In the IP Services area, click the link to the service you want to monitor.
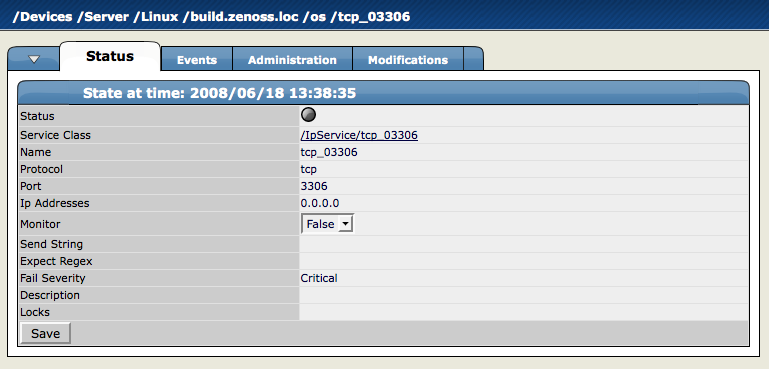
The service summary for the service you have selected appears.
Set the Monitored flag to True to monitor this service for only this machine. You can also set this service to be monitored system-wide.
To monitor a service system wide, click the Click the Service Class link.
This page will show you everywhere the service is running and whether the service is monitored or not.
Click the Edit tab and set Monitored to True.
This will turn on monitoring for every instance of this service in the system.
Click Save.
Click the Status tab again.
Most of the instances of the Service will now be set to green, meaning they are monitored and up. The ones that remain unmonitored indicate that they have this service class set to not monitor at a local level.
#1.4. Monitoring Processes
Zenoss is able to monitor all processes running on your network. Zenoss process monitoring flow is illustrated by the following diagram:
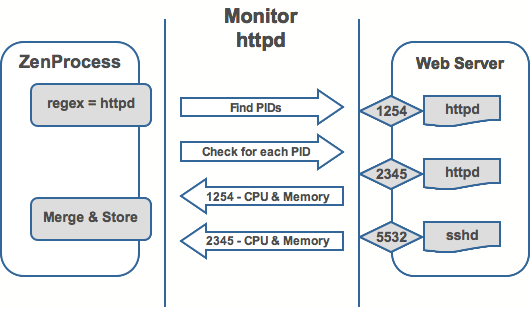
ZenProcess uses a regular expression match to find PIDs matching the expression to see that these processes are running on the selected device.
#1.4.1. Adding Processes to Monitor
To add a process to monitor:
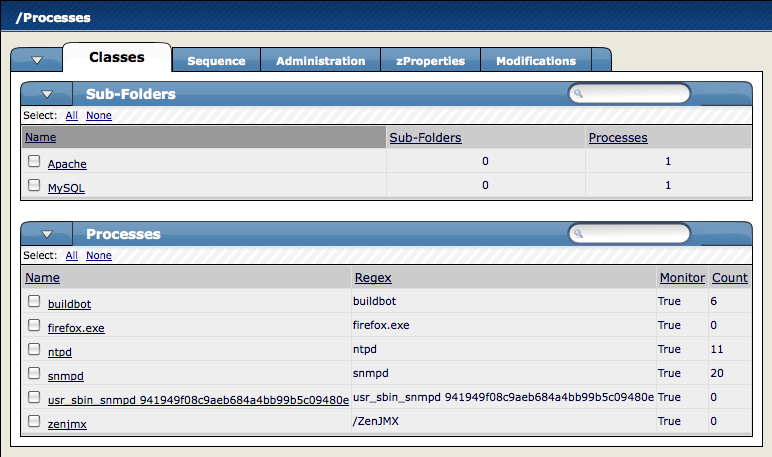
From the left navigation menu, select Processes.
The Processes page appears.
From the Processes table menu, select Add Process.
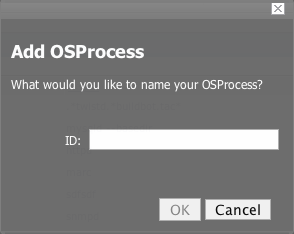
The Add OS Process Dialog Appears.
Enter the regular expression name of the process you want to monitor in the Processes field, and then click OK.
The process is added. The Processes window re-appears, showing the process you entered.
Now you are monitoring this process. After the device is remodeled (at the next remodeling interval or manually), it will show every device (occurrence) where this process is running. As such, the process is now being monitored wherever it occurs.
Clicking on a specific process will take you to an interface that shows all instances of that process running across machines that have it monitored. If the process has multiple instances the Zenoss will monitor the sum of CPU and memory utilization of all processes as well as the count of total processes running. However, if the process has only a single instance, CPU utilization and memory usage are graphed for the single process. To perform process monitoring using the
zenprocessdaemon, the device's SNMP agent must show the process information through the HOST- RESOURCES MIB.
#1.4.2. Configuring Process zProperties
You can configure zProperties for all processes, for an individual process, or for any processes that fall further down in the process hierarchy tree. To configure them for all processes click the zProperties tab from the Process Overview tab. To configure zProperties for an individual process, click on the process name in the Process Overview and then click the zProperties tab for that process. The Process zProperties Tab appears.
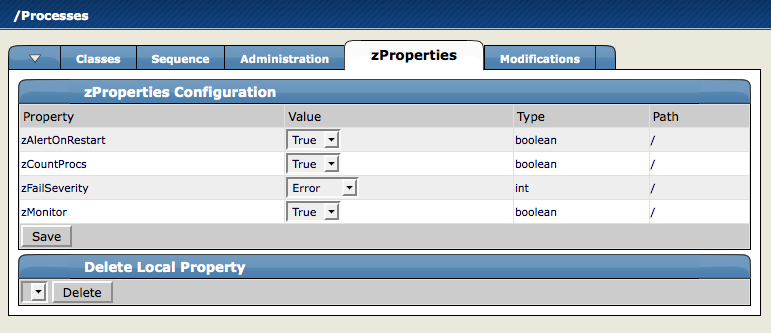
You can configure the following zProperties for either all processes or the selected process from this tab:
ZAlertOnRestart
ZCountProcs
ZFailSeverity
zMonitor
For more information about the Services zProperties, see the zProperties Appendix.
